
- LIVE QUOTES
- LEARN
- HELP
 Nasdaq
 Wall Street Journal
EN
Barrick Gold (NYSE:GOLD): Evaluating Valuation After a 170% One-Year Rally
Shifting identity and sustained momentum
Barrick Mining (B) has quietly turned into one of the stronger performers in materials, with the stock up about 46% over the past 3 months and roughly 170% over the past year.
See our latest analysis for Barrick Mining.
That rally has not been a straight line. However, the recent 15.9% 1 month share price return and powerful 1 year total shareholder return of around 170% suggest momentum is still very much building as investors reassess Barrick’s growth and risk profile.
If Barrick’s surge has you rethinking where the next big move could come from, it might be worth exploring fast growing stocks with high insider ownership as a way to spot other high conviction ideas.
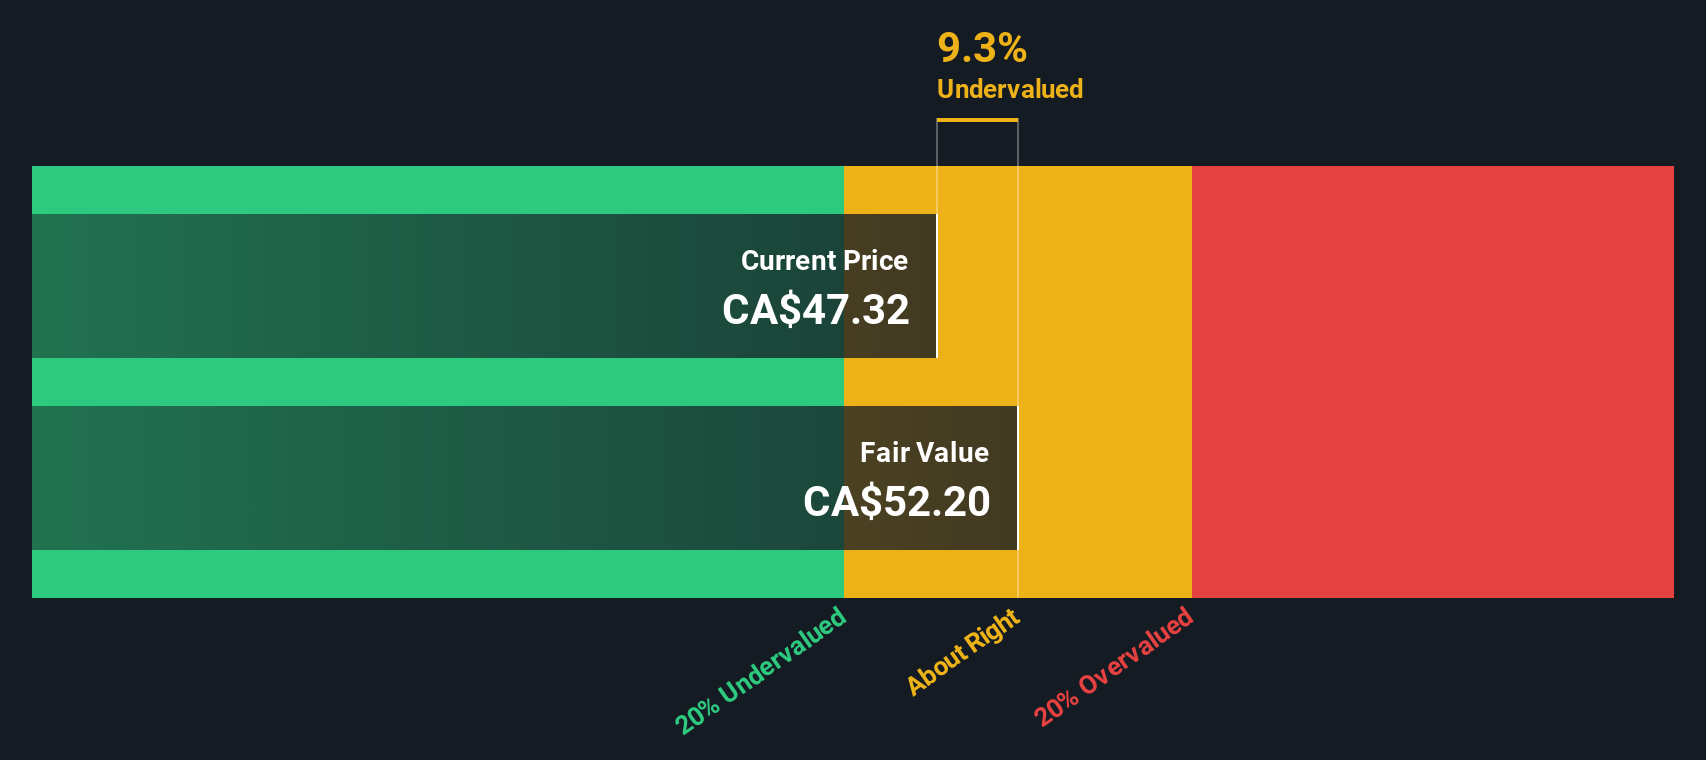
With earnings growing, the share price surging and the stock still trading below consensus targets, investors now face a key question: Is Barrick still undervalued, or is the market already pricing in its future growth?
Price-to-Earnings of 20.2x: Is it justified?
Barrick Mining currently trades on a price-to-earnings ratio of 20.2 times, below both direct peers and the broader US Metals and Mining industry, despite its strong share price run and sharp earnings rebound.
The price-to-earnings multiple compares the company’s share price with its per share earnings. It is a direct gauge of how much investors are paying for each dollar of profit. For a cyclical, capital intensive miner with recently accelerating profits, this lens is particularly useful because it shows whether the market is already incorporating higher through-the-cycle earnings or still discounting them.
On that basis, Barrick looks modestly priced rather than stretched, trading below the peer group average P/E of 24.1 times and the sector average of 24.3 times, even after earnings grew far faster than the industry over the past year. The SWS fair P/E estimate of 26.7 times also sits meaningfully higher than today’s multiple, which suggests there could be room for the market to re-rate if current profit trends prove sustainable.
Explore the SWS fair ratio for Barrick Mining
Result: Price-to-Earnings of 20.2x (UNDERVALUED)
However, sustained outperformance is not guaranteed, and exposure to volatile commodity prices and execution risk across large, capital intensive projects could challenge the bullish case.
Find out about the key risks to this Barrick Mining narrative.
Another angle on value
Our SWS DCF model paints a much more dramatic picture, suggesting Barrick’s shares trade at a steep discount to fair value, around 65.6% below our estimate. If that gap closes only partially, could today’s price still offer outsized long term upside?
Look into how the SWS DCF model arrives at its fair value.
Simply Wall St performs a discounted cash flow (DCF) on every stock in the world every day (check out Barrick Mining for example). We show the entire calculation in full. You can track the result in your watchlist or portfolio and be alerted when this changes, or use our stock screener to discover 915 undervalued stocks based on their cash flows. If you save a screener we even alert you when new companies match - so you never miss a potential opportunity.
Build Your Own Barrick Mining Narrative
If you would rather review the numbers yourself and reach your own conclusions, you can build a personalised narrative in under three minutes: Do it your way.
A great starting point for your Barrick Mining research is our analysis highlighting 4 key rewards and 2 important warning signs that could impact your investment decision.
Ready for your next investing move?
Do not stop at Barrick. Use the Simply Wall Street Screener to quickly pinpoint other high potential opportunities before the crowd catches on and prices reset.
- Capture potential mispricing by targeting these 915 undervalued stocks based on cash flows that the market has not fully appreciated yet.
- Position yourself for innovation-driven growth by pursuing these 25 AI penny stocks shaping the future of automation and intelligent software.
- Strengthen your income stream by focusing on these 13 dividend stocks with yields > 3% that can help support long term total returns.
This article by Simply Wall St is general in nature. We provide commentary based on historical data and analyst forecasts only using an unbiased methodology and our articles are not intended to be financial advice. It does not constitute a recommendation to buy or sell any stock, and does not take account of your objectives, or your financial situation. We aim to bring you long-term focused analysis driven by fundamental data. Note that our analysis may not factor in the latest price-sensitive company announcements or qualitative material. Simply Wall St has no position in any stocks mentioned.
Have feedback on this article? Concerned about the content? Get in touch with us directly. Alternatively, email editorial-team@simplywallst.com