
- LIVE QUOTES
- LEARN
- HELP
 Nasdaq
 Wall Street Journal
EN
Retail investors invested in Scilex Holding Company (NASDAQ:SCLX) copped the brunt of last week's US$12m market cap decline
Key Insights
- The considerable ownership by retail investors in Scilex Holding indicates that they collectively have a greater say in management and business strategy
- 43% of the business is held by the top 25 shareholders
- 13% of Scilex Holding is held by Institutions
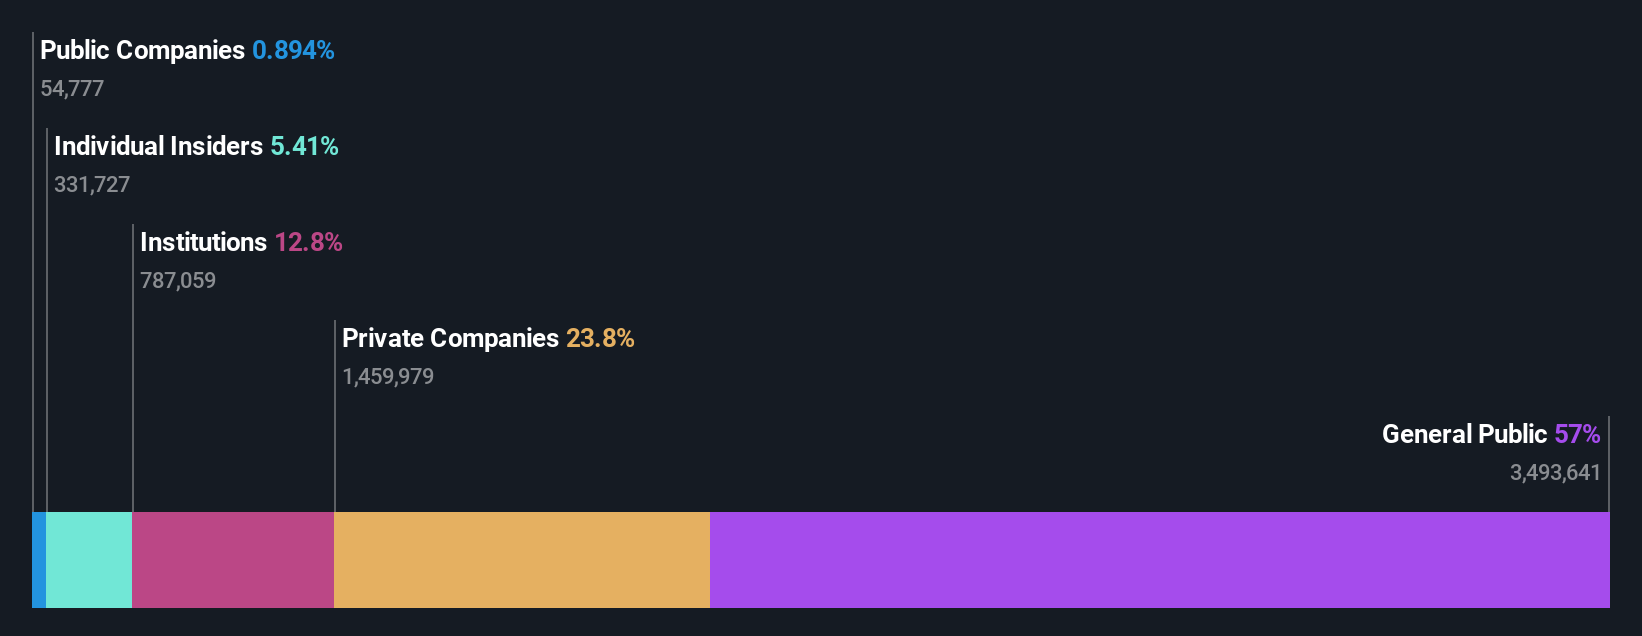
To get a sense of who is truly in control of Scilex Holding Company (NASDAQ:SCLX), it is important to understand the ownership structure of the business. And the group that holds the biggest piece of the pie are retail investors with 57% ownership. Put another way, the group faces the maximum upside potential (or downside risk).
As a result, retail investors as a group endured the highest losses last week after market cap fell by US$12m.
Let's delve deeper into each type of owner of Scilex Holding, beginning with the chart below.
View our latest analysis for Scilex Holding
What Does The Institutional Ownership Tell Us About Scilex Holding?
Many institutions measure their performance against an index that approximates the local market. So they usually pay more attention to companies that are included in major indices.
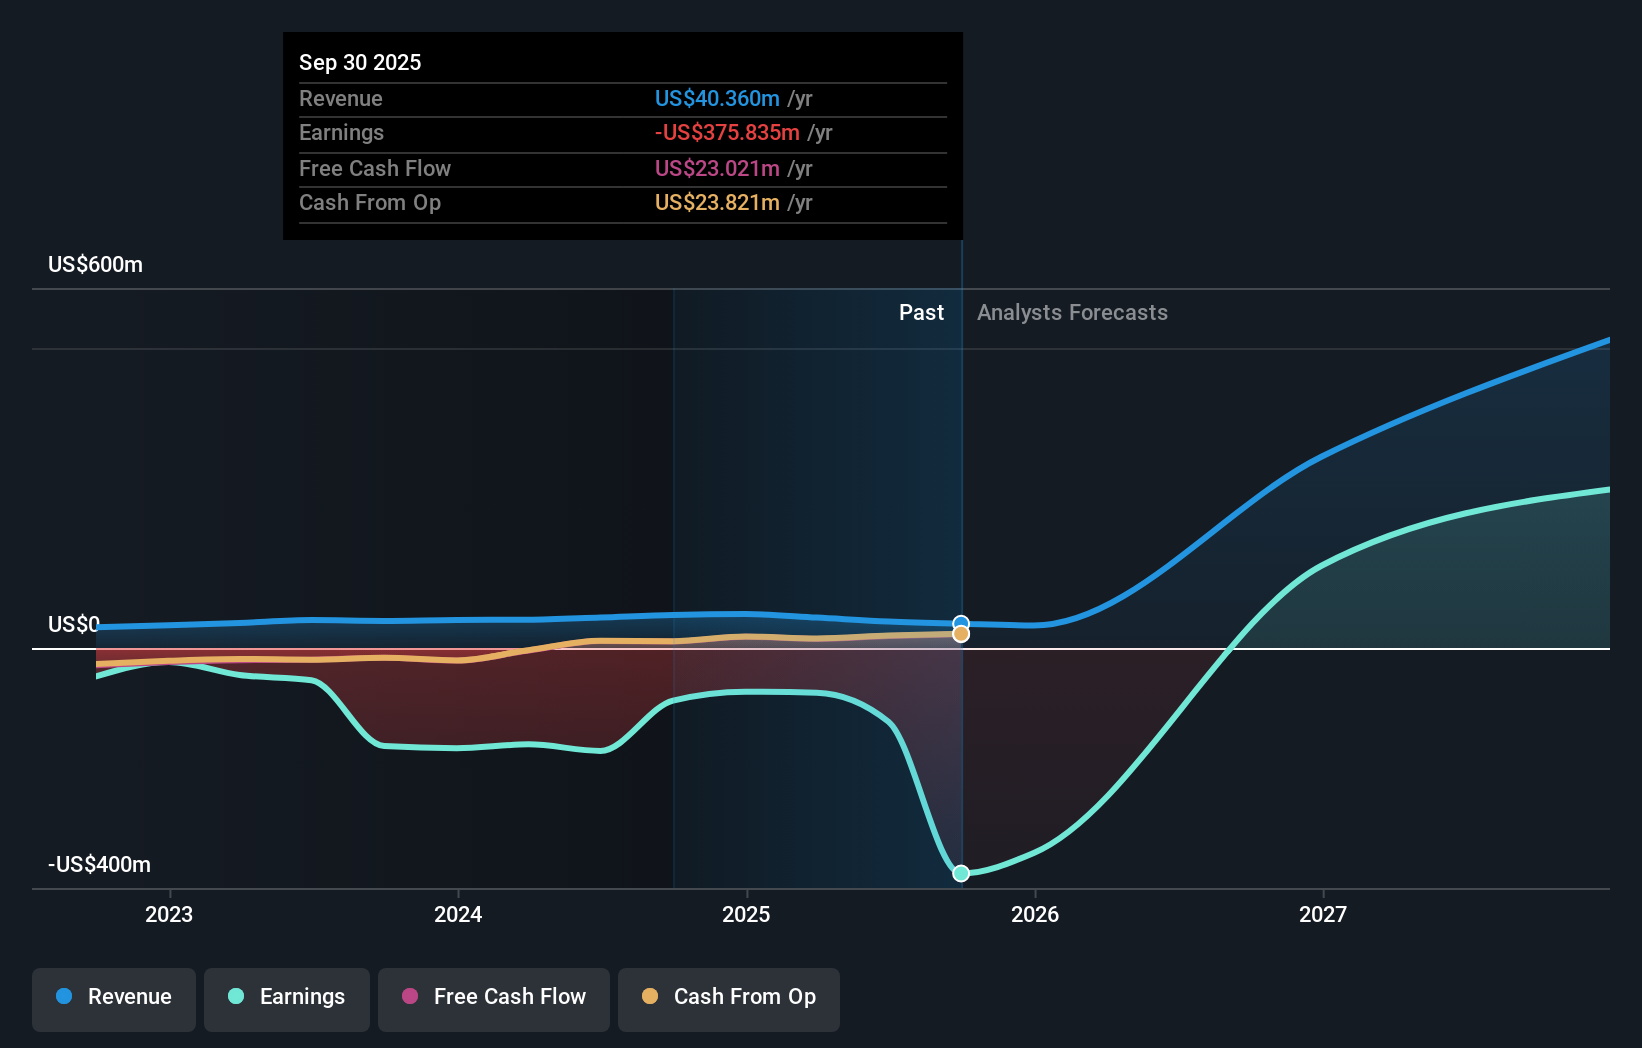
We can see that Scilex Holding does have institutional investors; and they hold a good portion of the company's stock. This implies the analysts working for those institutions have looked at the stock and they like it. But just like anyone else, they could be wrong. It is not uncommon to see a big share price drop if two large institutional investors try to sell out of a stock at the same time. So it is worth checking the past earnings trajectory of Scilex Holding, (below). Of course, keep in mind that there are other factors to consider, too.
Hedge funds don't have many shares in Scilex Holding. Our data shows that Sclx Stock Acquisition Jv Llc is the largest shareholder with 24% of shares outstanding. Meanwhile, the second and third largest shareholders, hold 4.9% and 4.6%, of the shares outstanding, respectively.
On studying our ownership data, we found that 25 of the top shareholders collectively own less than 50% of the share register, implying that no single individual has a majority interest.
While studying institutional ownership for a company can add value to your research, it is also a good practice to research analyst recommendations to get a deeper understand of a stock's expected performance. There is some analyst coverage of the stock, but it could still become more well known, with time.
Insider Ownership Of Scilex Holding
The definition of company insiders can be subjective and does vary between jurisdictions. Our data reflects individual insiders, capturing board members at the very least. The company management answer to the board and the latter should represent the interests of shareholders. Notably, sometimes top-level managers are on the board themselves.
Most consider insider ownership a positive because it can indicate the board is well aligned with other shareholders. However, on some occasions too much power is concentrated within this group.
Shareholders would probably be interested to learn that insiders own shares in Scilex Holding Company. As individuals, the insiders collectively own US$5.5m worth of the US$101m company. This shows at least some alignment, but we usually like to see larger insider holdings. You can click here to see if those insiders have been buying or selling.
General Public Ownership
The general public, mostly comprising of individual investors, collectively holds 57% of Scilex Holding shares. With this amount of ownership, retail investors can collectively play a role in decisions that affect shareholder returns, such as dividend policies and the appointment of directors. They can also exercise the power to vote on acquisitions or mergers that may not improve profitability.
Private Company Ownership
It seems that Private Companies own 24%, of the Scilex Holding stock. Private companies may be related parties. Sometimes insiders have an interest in a public company through a holding in a private company, rather than in their own capacity as an individual. While it's hard to draw any broad stroke conclusions, it is worth noting as an area for further research.
Next Steps:
I find it very interesting to look at who exactly owns a company. But to truly gain insight, we need to consider other information, too. To that end, you should learn about the 3 warning signs we've spotted with Scilex Holding (including 2 which can't be ignored) .
If you are like me, you may want to think about whether this company will grow or shrink. Luckily, you can check this free report showing analyst forecasts for its future.
NB: Figures in this article are calculated using data from the last twelve months, which refer to the 12-month period ending on the last date of the month the financial statement is dated. This may not be consistent with full year annual report figures.
Have feedback on this article? Concerned about the content? Get in touch with us directly. Alternatively, email editorial-team (at) simplywallst.com.
This article by Simply Wall St is general in nature. We provide commentary based on historical data and analyst forecasts only using an unbiased methodology and our articles are not intended to be financial advice. It does not constitute a recommendation to buy or sell any stock, and does not take account of your objectives, or your financial situation. We aim to bring you long-term focused analysis driven by fundamental data. Note that our analysis may not factor in the latest price-sensitive company announcements or qualitative material. Simply Wall St has no position in any stocks mentioned.