
- LIVE QUOTES
- LEARN
- HELP
 Nasdaq
 Wall Street Journal
EN
Is Acadia Realty Trust Attractively Priced After a 17% Slide in 2025?
- Wondering if Acadia Realty Trust is a bargain or a value trap at current levels? You are not alone, and this breakdown is designed to cut through the noise and focus on what the stock is really worth.
- After a strong multi year climb of about 60.0% over 3 years and 72.4% over 5 years, the stock has stumbled recently, with the price near $19.78 and returns of around -0.5% over 7 days, -1.9% over 30 days, and a deeper slide of -17.2% year to date and -18.3% over the last year.
- Those mixed returns have come as investors reassess retail focused REITs in light of shifting consumer behavior and evolving demand for open air shopping centers. At the same time, news flow around interest rates, refinancing conditions, and appetite for high quality urban and suburban properties has been shaping how the market values Acadia’s portfolio.
- Right now, Acadia scores a 3 out of 6 on our valuation checks, suggesting pockets of undervaluation but not an across the board steal. We will walk through DCF, multiples, and asset based views next before finishing with a more intuitive way to think about what fair value really means for long term investors.
Find out why Acadia Realty Trust's -18.3% return over the last year is lagging behind its peers.
Approach 1: Acadia Realty Trust Discounted Cash Flow (DCF) Analysis
A Discounted Cash Flow model projects Acadia Realty Trust’s adjusted funds from operations into the future and then discounts those cash flows back to today’s value in $ to estimate what the business is worth now.
Acadia generated about $134.5 Million in free cash flow over the last twelve months. Analyst forecasts, combined with Simply Wall St extrapolations, indicate projected free cash flow of roughly $280.6 Million by 2035, assuming cash flows grow at mid single digit rates over time as the portfolio matures and rents increase.
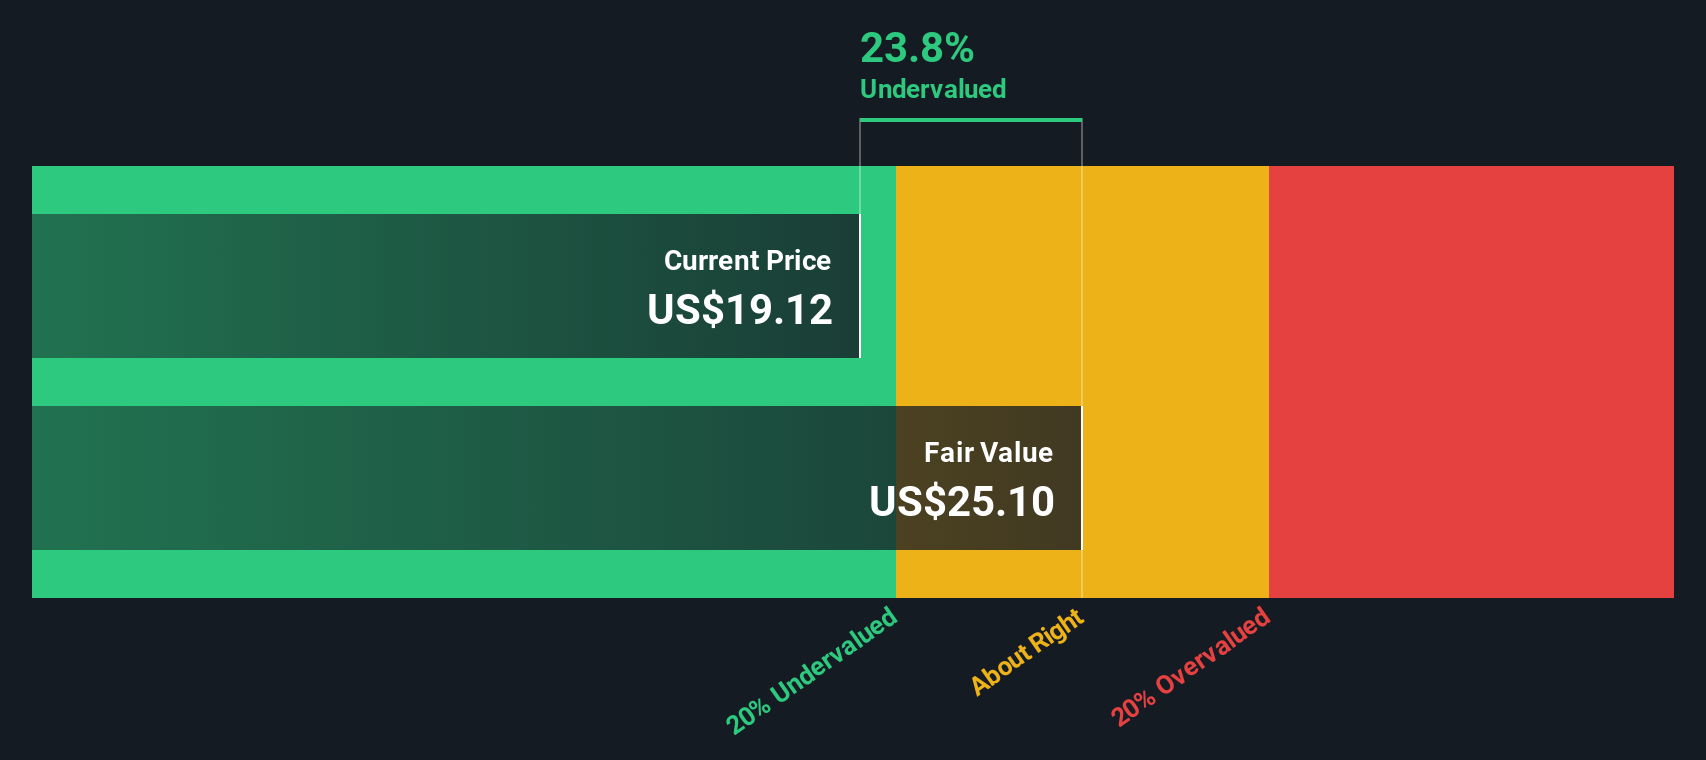
Using a 2 Stage Free Cash Flow to Equity approach, the model arrives at an intrinsic value of about $29.05 per share. Compared to the recent market price near $19.78, this suggests the stock is trading at a 31.9% discount to the model’s estimated fair value, which may indicate that investors are being cautious about future growth or financing conditions.
Result: UNDERVALUED
Our Discounted Cash Flow (DCF) analysis suggests Acadia Realty Trust is undervalued by 31.9%. Track this in your watchlist or portfolio, or discover 915 more undervalued stocks based on cash flows.
Approach 2: Acadia Realty Trust Price vs Sales
For profitable REITs like Acadia Realty Trust, the price to sales ratio is a useful way to judge how much investors are paying for each dollar of revenue, especially when earnings can be affected by non cash items and property revaluations. In general, faster growth and lower perceived risk justify a higher multiple, while slower growth or higher uncertainty call for a lower, more conservative ratio.
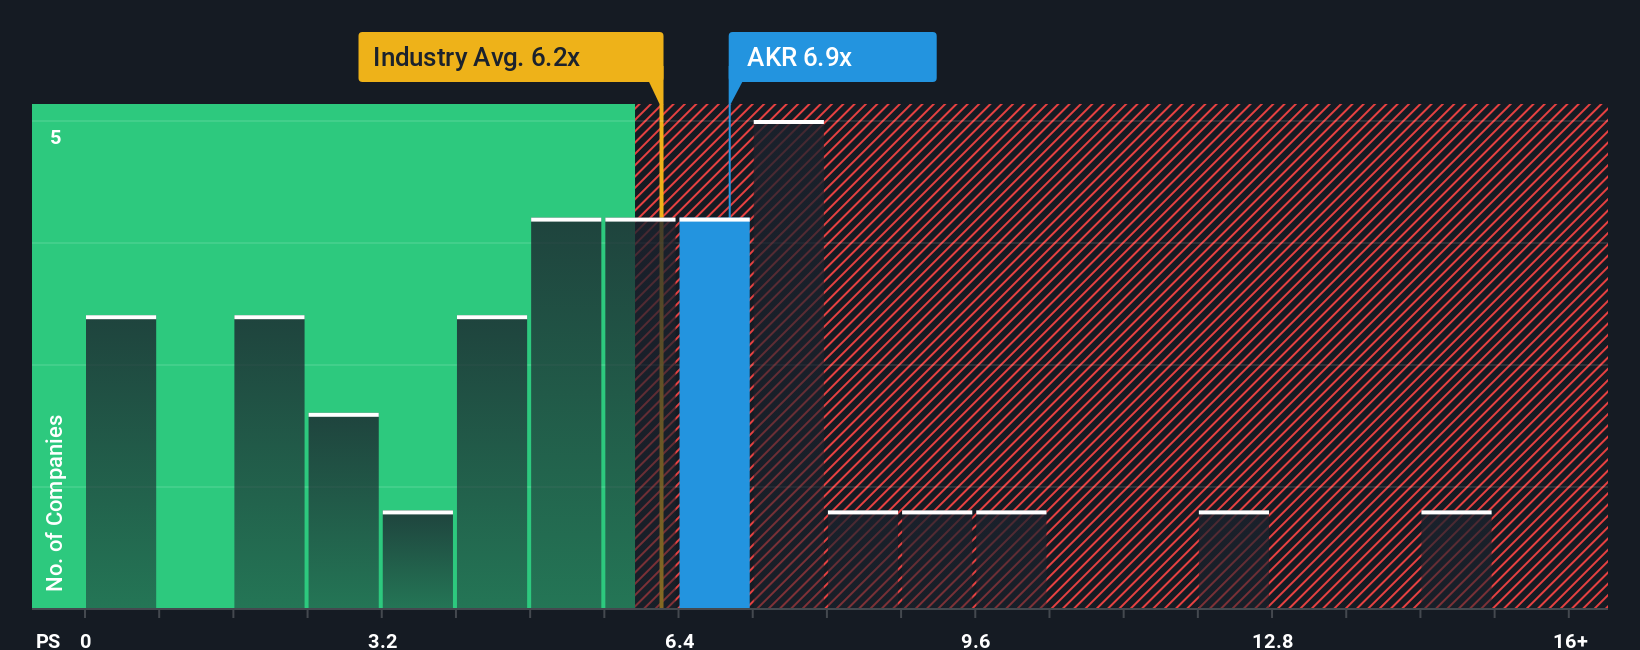
Acadia currently trades on a price to sales multiple of about 6.65x, which is slightly above the Retail REITs industry average of roughly 6.08x and below the peer group average of about 8.62x. Simply Wall St also estimates a Fair Ratio of around 5.06x, a proprietary view of what would be a reasonable price to sales multiple for Acadia given its growth outlook, risk profile, margins, market cap and industry position.
This Fair Ratio is more tailored than a simple comparison with peers or the industry, as it adjusts for the company’s own fundamentals rather than assuming all REITs deserve the same pricing. Comparing the Fair Ratio of 5.06x with the actual 6.65x suggests the shares are pricing in more optimism than the model implies, pointing to mild overvaluation on this measure.
Result: OVERVALUED
PS ratios tell one story, but what if the real opportunity lies elsewhere? Discover 1460 companies where insiders are betting big on explosive growth.
Upgrade Your Decision Making: Choose your Acadia Realty Trust Narrative
Earlier we mentioned that there is an even better way to understand valuation, so let us introduce you to Narratives, a simple way to turn your view of Acadia Realty Trust into a story that connects the numbers you assume, like future revenue, earnings, margins and fair value, with the reasons you believe they are realistic.
A Narrative on Simply Wall St links three pieces together: your understanding of Acadia’s business and industry, a financial forecast built from that view, and a fair value estimate that shows what you think the shares are really worth today.
On the Community page, millions of investors use Narratives as an easy, accessible tool to decide when to buy or sell by comparing their Fair Value to the current Price and seeing how that gap changes as new information, such as earnings releases or news about rent spreads and acquisitions, automatically updates their Narrative in real time.
For example, one Acadia Narrative might lean bullish and land near the top end of analyst targets around $24 if you think dense urban corridors will keep delivering premium rent growth. A more cautious Narrative might sit closer to $20 if you are more focused on e commerce disruption, regulatory risk and capital market volatility.
Do you think there's more to the story for Acadia Realty Trust? Head over to our Community to see what others are saying!

This article by Simply Wall St is general in nature. We provide commentary based on historical data and analyst forecasts only using an unbiased methodology and our articles are not intended to be financial advice. It does not constitute a recommendation to buy or sell any stock, and does not take account of your objectives, or your financial situation. We aim to bring you long-term focused analysis driven by fundamental data. Note that our analysis may not factor in the latest price-sensitive company announcements or qualitative material. Simply Wall St has no position in any stocks mentioned.
Have feedback on this article? Concerned about the content? Get in touch with us directly. Alternatively, email editorial-team@simplywallst.com