
- LIVE QUOTES
- LEARN
- HELP
 Nasdaq
 Wall Street Journal
EN
Is It Too Late To Consider Equinox Gold After Its 150% 2025 Rally?
- Wondering if Equinox Gold is still good value after its huge run up, or if you are late to the party? This breakdown will give you a clear, valuation-first view of the stock.
- Despite a small pullback of 1.4% over the last week, the shares are still up 7.1% over 30 days, 149.6% year to date and 295.0% over three years, which naturally raises questions about how much upside might be left.
- Behind those moves, investors have been reacting to a mix of operational updates across Equinox Gold's mine portfolio and shifting expectations for gold prices, both of which can quickly change how the market values a producer. There has also been growing attention on the company from institutional investors looking for leverage to gold, which tends to amplify both optimism and risk in the share price.
- Right now Equinox Gold scores a solid 5 out of 6 on our valuation checks, suggesting the market may still be underestimating it. Next we will unpack what that means across different valuation methods and hint at an even better way to think about fair value that we will return to at the end of the article.
Approach 1: Equinox Gold Discounted Cash Flow (DCF) Analysis
The Discounted Cash Flow model estimates what a business is worth today by projecting the cash it could generate in the future and discounting those cash flows back to their value in the present.
For Equinox Gold, the model used is a 2 Stage Free Cash Flow to Equity approach, built on cash flow projections in $. While the latest twelve months free cash flow is negative at roughly $75.6 Million, analysts expect an improvement as new and existing mines ramp up. By 2029, free cash flow is projected to reach about $1.53 Billion, and then continue to grow more moderately over the following years based on Simply Wall St extrapolations beyond the analyst forecast window.
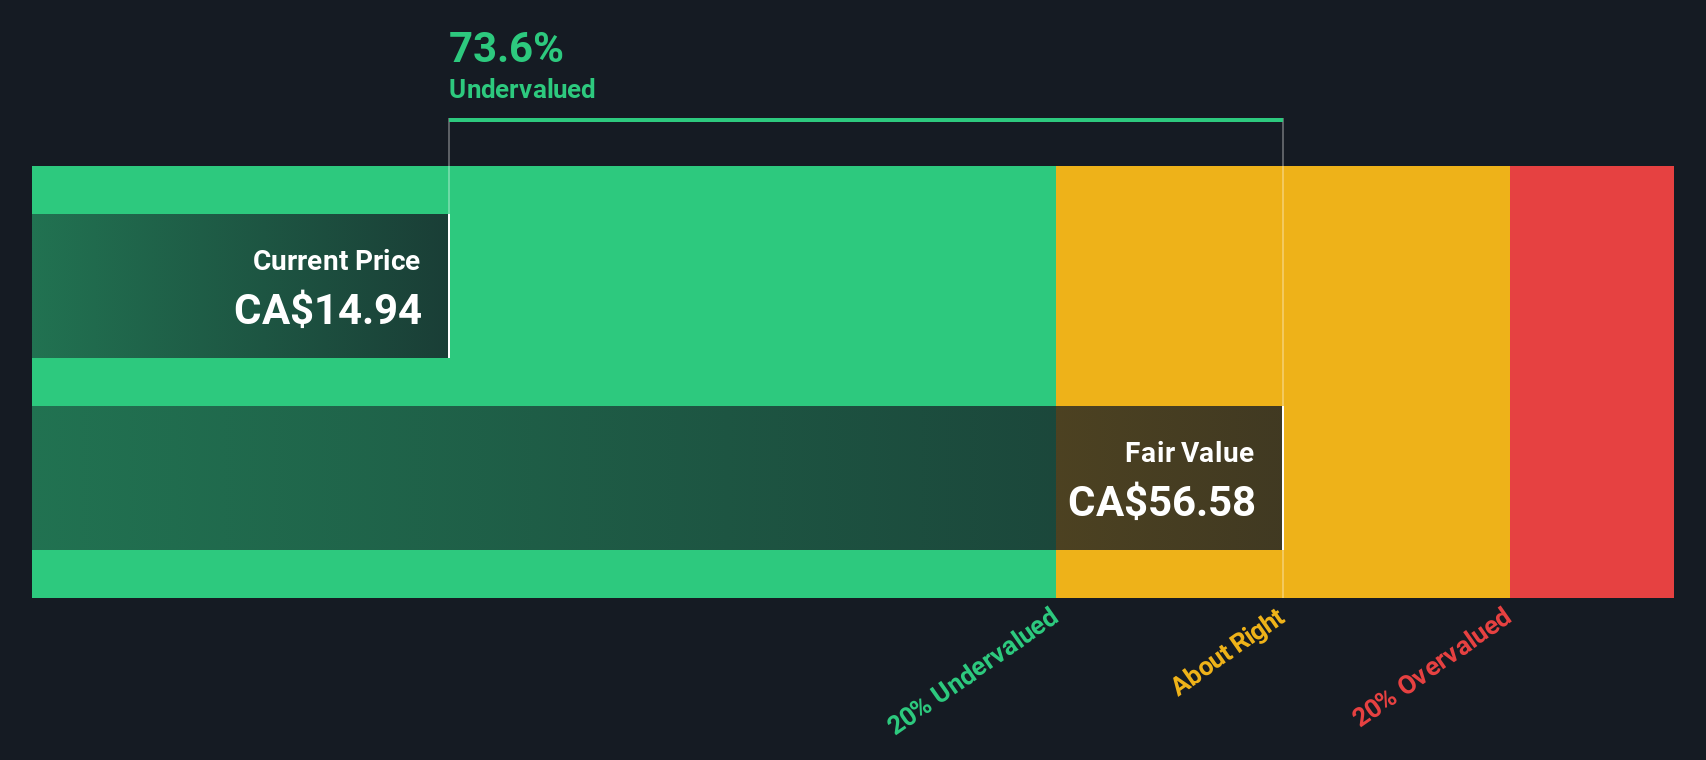
Bringing all those projected cash flows back to today, the DCF model suggests an estimated intrinsic value of about $51.56 per share. On this basis, Equinox Gold is trading at roughly a 62.9% discount to this estimated fair value if these projections are realized.
Result: UNDERVALUED
Our Discounted Cash Flow (DCF) analysis suggests Equinox Gold is undervalued by 62.9%. Track this in your watchlist or portfolio, or discover 915 more undervalued stocks based on cash flows.
Approach 2: Equinox Gold Price vs Sales
For companies where profits can swing with commodity prices and investment cycles, the price to sales multiple is often a cleaner way to gauge value, because revenue tends to be more stable than earnings from year to year. Investors are usually willing to pay a higher or lower multiple of sales depending on how fast they expect those sales to grow and how risky they perceive the business to be, so growth potential and balance sheet strength both feed into what a normal valuation should look like.
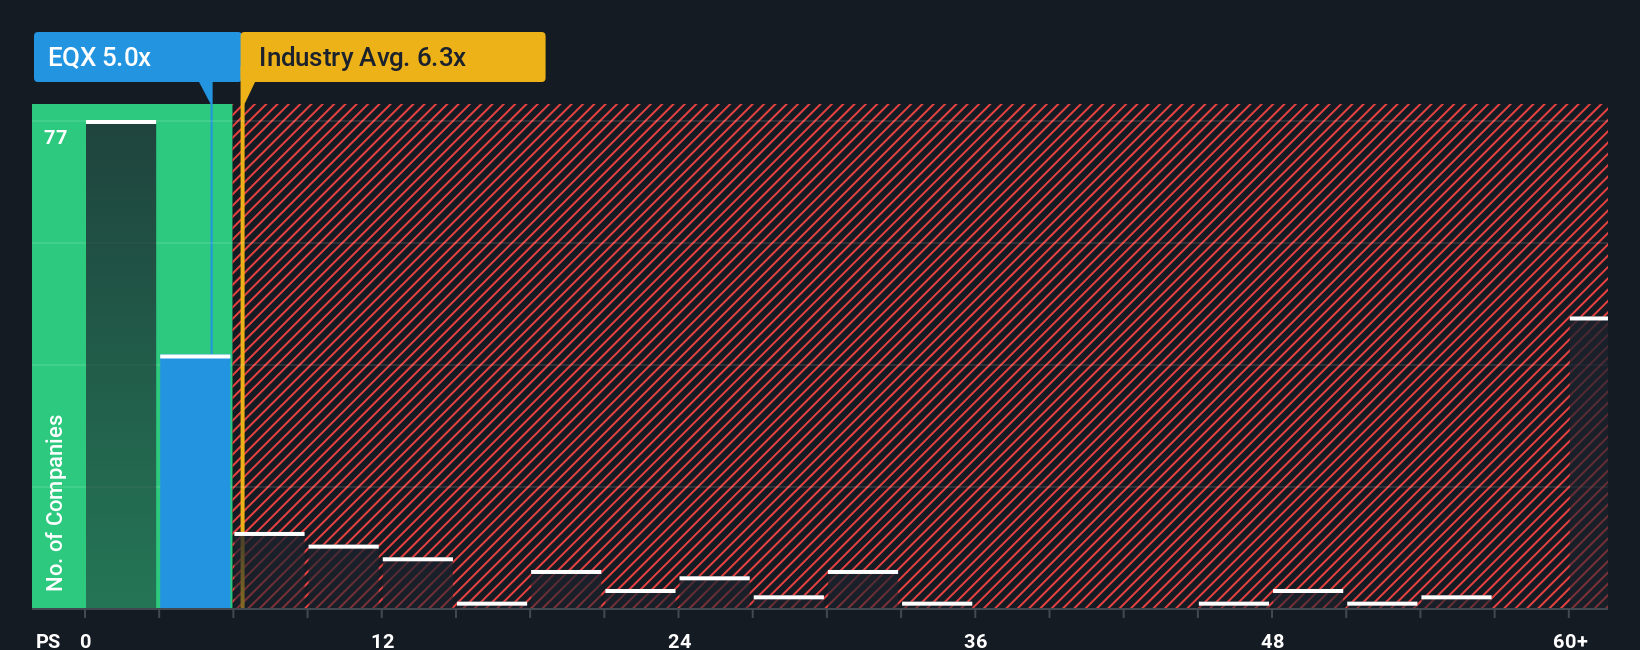
Equinox Gold currently trades on a price to sales ratio of about 4.75x, which is below the broader Metals and Mining industry average of roughly 6.55x and well below the 9.28x average of its closer peer group. Simply Wall St also calculates a proprietary Fair Ratio of 4.29x, which is the price to sales multiple you would expect given Equinox Gold’s specific mix of growth prospects, profit margins, size and risk profile. This Fair Ratio is more informative than a simple peer or industry comparison because it is tailored to the company rather than assuming all miners deserve the same multiple. With the current 4.75x sitting modestly above the 4.29x Fair Ratio, Equinox Gold screens as slightly expensive on this metric.
Result: OVERVALUED
PS ratios tell one story, but what if the real opportunity lies elsewhere? Discover 1460 companies where insiders are betting big on explosive growth.
Upgrade Your Decision Making: Choose your Equinox Gold Narrative
Earlier we mentioned that there is an even better way to understand valuation, so let us introduce you to Narratives, a simple way to connect your view of Equinox Gold’s future to concrete numbers like revenue, earnings, margins and ultimately fair value. A Narrative is just your story about the company, translated into a financial forecast and a fair value estimate. Instead of only looking at static multiples or price targets, you spell out why you think production, costs and gold prices will move a certain way and see what that implies for the stock. On Simply Wall St, millions of investors do this on the Community page by building Narratives that instantly compare their Fair Value to the current share price to help decide whether Equinox Gold looks like a buy, hold or sell. Those Narratives automatically update as new earnings, guidance or news comes in. For Equinox Gold today, one Narrative on the bullish end might see fair value near CA$22 based on strong ramp ups, while a more cautious Narrative might sit closer to CA$9 to CA$10. Seeing that spread makes it clear where your own view fits and what has to go right or wrong for you to be correct.
Do you think there's more to the story for Equinox Gold? Head over to our Community to see what others are saying!

This article by Simply Wall St is general in nature. We provide commentary based on historical data and analyst forecasts only using an unbiased methodology and our articles are not intended to be financial advice. It does not constitute a recommendation to buy or sell any stock, and does not take account of your objectives, or your financial situation. We aim to bring you long-term focused analysis driven by fundamental data. Note that our analysis may not factor in the latest price-sensitive company announcements or qualitative material. Simply Wall St has no position in any stocks mentioned.
Have feedback on this article? Concerned about the content? Get in touch with us directly. Alternatively, email editorial-team@simplywallst.com