
- LIVE QUOTES
- LEARN
- HELP
 Nasdaq
 Wall Street Journal
EN
Is Exor’s Share Price Slide Creating an Opportunity for Long Term Investors?
- Wondering whether Exor at around €72 a share is quietly turning into a bargain, or if the market is seeing something you do not? Let us walk through what the price is really telling us about value.
- Over the last week the stock has inched up about 0.4%, but that comes after a tougher stretch with the shares down roughly 3.1% over 30 days and about 18.5% over the past year, even though the 3 year return is still positive at around 7.5%.
- Those moves are happening against a backdrop of ongoing portfolio reshaping and capital allocation decisions at Exor, as the company continues to recycle capital across its industrial and investment holdings. Strategic shifts like these can change how investors think about future returns and risk, which often shows up in the share price before the story feels obvious.
- Right now Exor scores a solid 5 out of 6 on our undervaluation checks. This suggests there is more value here than the recent price performance implies. In the sections ahead we will break that score down across different valuation methods, then finish with an additional way of thinking about what the stock is truly worth.
Find out why Exor's -18.5% return over the last year is lagging behind its peers.
Approach 1: Exor Excess Returns Analysis
The Excess Returns model evaluates how much value a company creates above the basic return investors demand on its equity, then capitalizes those extra profits into an intrinsic value per share.
For Exor, the analysis starts with a Book Value of €180.42 per share and an Average Return on Equity of 19.51%. That level of profitability supports a Stable EPS estimate of €20.76 per share, based on the median return on equity over the past 5 years, versus a Cost of Equity of €6.27 per share. The difference between the two is an Excess Return of €14.48 per share, which the model assumes can be sustained on a Stable Book Value base of €106.38 per share, derived from the median book value over the past 5 years.
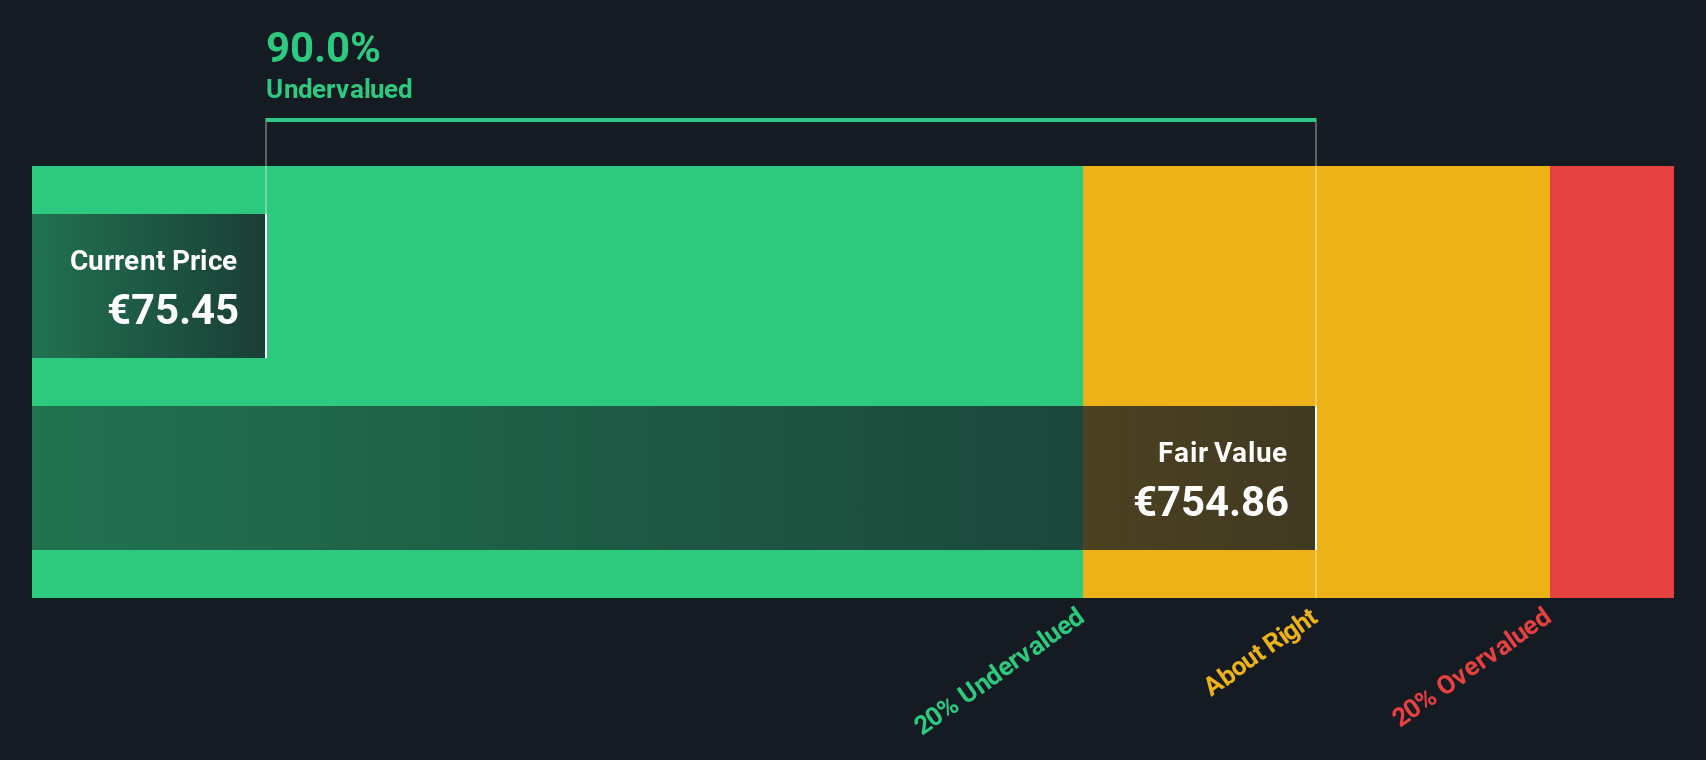
When these excess returns are projected and discounted, the model arrives at an intrinsic value of about €459.79 per share, implying the stock is roughly 84.3% undervalued relative to the current price near €72. On this framework, the market appears to be assigning limited value to Exor’s ability to continue compounding value.
Result: UNDERVALUED
Our Excess Returns analysis suggests Exor is undervalued by 84.3%. Track this in your watchlist or portfolio, or discover 915 more undervalued stocks based on cash flows.
Approach 2: Exor Price vs Book
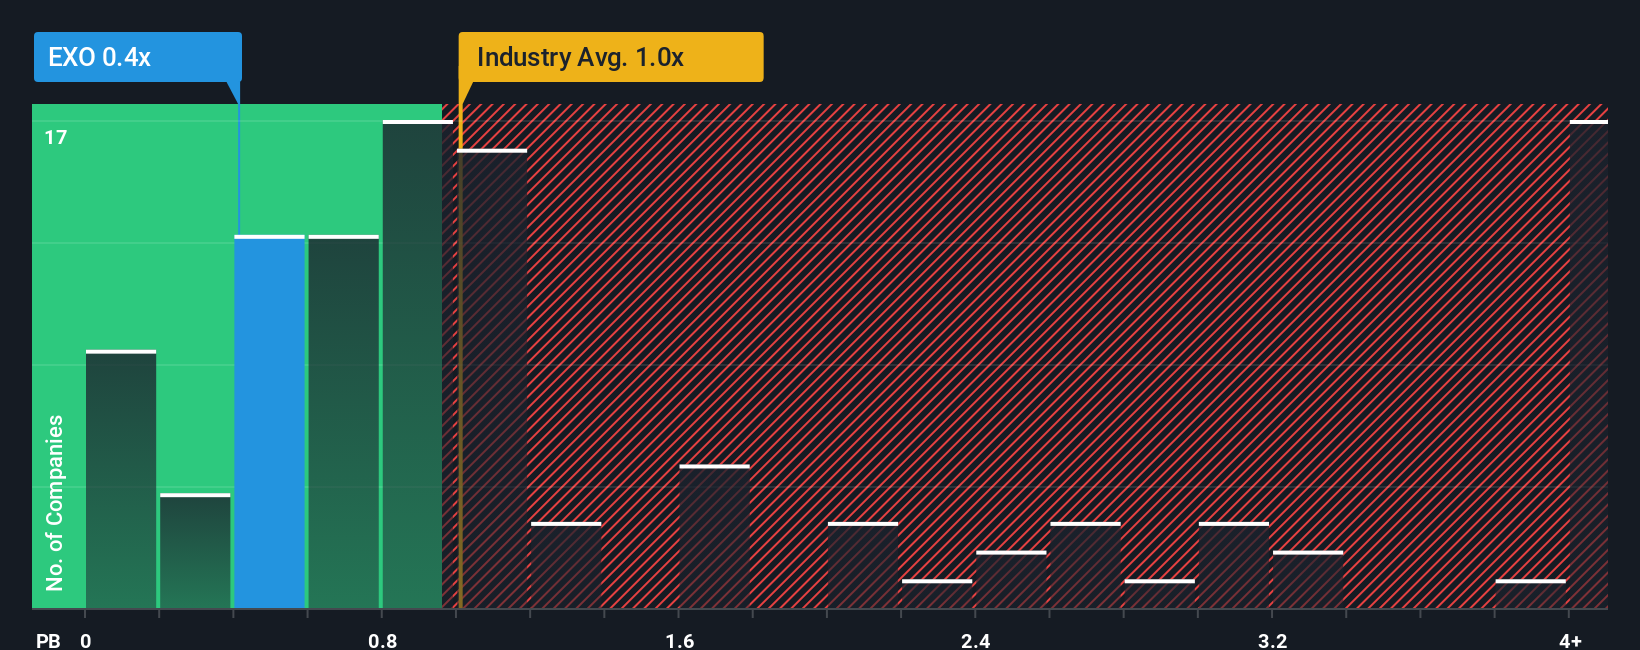
For asset-heavy, investment-focused groups like Exor, the price-to-book ratio is often the cleanest way to think about valuation, because it compares what you pay in the market to the net assets and investments the company controls on its balance sheet.
In general, investors are willing to pay a higher price-to-book multiple when they expect stronger growth in net asset value and see lower risk, and they demand a lower multiple when returns look volatile or uncertain. Against this backdrop, Exor currently trades at about 0.41x book value, which is not only well below the diversified financials industry average of roughly 1.15x, but also far beneath the broader peer group sitting around 6.14x. That kind of discount suggests the market is skeptical about the durability of Exor's returns or the quality of its underlying assets.
Simply Wall St's Fair Ratio is designed to refine this view by estimating the price-to-book multiple Exor should trade on after adjusting for its earnings power, growth profile, industry, margins, market cap and risk. This is more informative than a simple peer or industry comparison, because it asks what is reasonable for Exor specifically, rather than what others happen to trade at. On this framework, Exor's actual 0.41x price-to-book looks well below its Fair Ratio, pointing to a meaningful valuation gap.
Result: UNDERVALUED
PB ratios tell one story, but what if the real opportunity lies elsewhere? Discover 1459 companies where insiders are betting big on explosive growth.
Upgrade Your Decision Making: Choose your Exor Narrative
Earlier we mentioned that there is an even better way to understand valuation, so let us introduce you to Narratives, a simple way to connect your view of Exor’s future with the numbers behind its fair value. A Narrative is your story about a company, translated into assumptions for revenue growth, earnings, margins and risk, which then flow directly into a financial forecast and a fair value estimate. On Simply Wall St’s Community page, used by millions of investors, Narratives are an easy, guided tool that help you turn a high level thesis into concrete numbers so you can clearly see whether Exor’s fair value sits above or below today’s share price, and decide if it looks like a buy, hold or sell. These Narratives update dynamically when fresh information arrives, like new earnings or major news, so your view stays current without needing to rebuild your analysis from scratch. For example, one Exor Narrative might assume strong double digit growth and a rich fair value, while another bakes in flat growth and a much lower fair value, yet both are transparent and comparable.
Do you think there's more to the story for Exor? Head over to our Community to see what others are saying!

This article by Simply Wall St is general in nature. We provide commentary based on historical data and analyst forecasts only using an unbiased methodology and our articles are not intended to be financial advice. It does not constitute a recommendation to buy or sell any stock, and does not take account of your objectives, or your financial situation. We aim to bring you long-term focused analysis driven by fundamental data. Note that our analysis may not factor in the latest price-sensitive company announcements or qualitative material. Simply Wall St has no position in any stocks mentioned.
Have feedback on this article? Concerned about the content? Get in touch with us directly. Alternatively, email editorial-team@simplywallst.com