
- PRICING
- LIVE QUOTES
- LEARN
- HELP


EN
ANYCOLOR (TSE:5032) valuation check as investors await updated fiscal 2026 guidance from board meeting
ANYCOLOR (TSE:5032) has scheduled a December 10 board meeting in Tokyo to revise its forecast for the year ending April 2026, putting fresh guidance squarely in focus for investors.
See our latest analysis for ANYCOLOR.
The stock has been volatile, with a 7 day share price return of minus 19.40 percent and a 30 day share price return of minus 27.68 percent. However, a year to date share price return of 76.53 percent and a 1 year total shareholder return of 72.10 percent suggest longer term momentum remains solid. This forecast update could help clarify whether recent weakness reflects profit taking or shifting growth expectations.
If this kind of guidance driven move has you rethinking your watchlist, it might be a good moment to explore fast growing stocks with high insider ownership for other compelling ideas.
With shares still trading at roughly a 30 percent discount to intrinsic estimates and over 40 percent below analyst price targets, is ANYCOLOR quietly undervalued ahead of revised guidance, or is the market already pricing in its future growth?
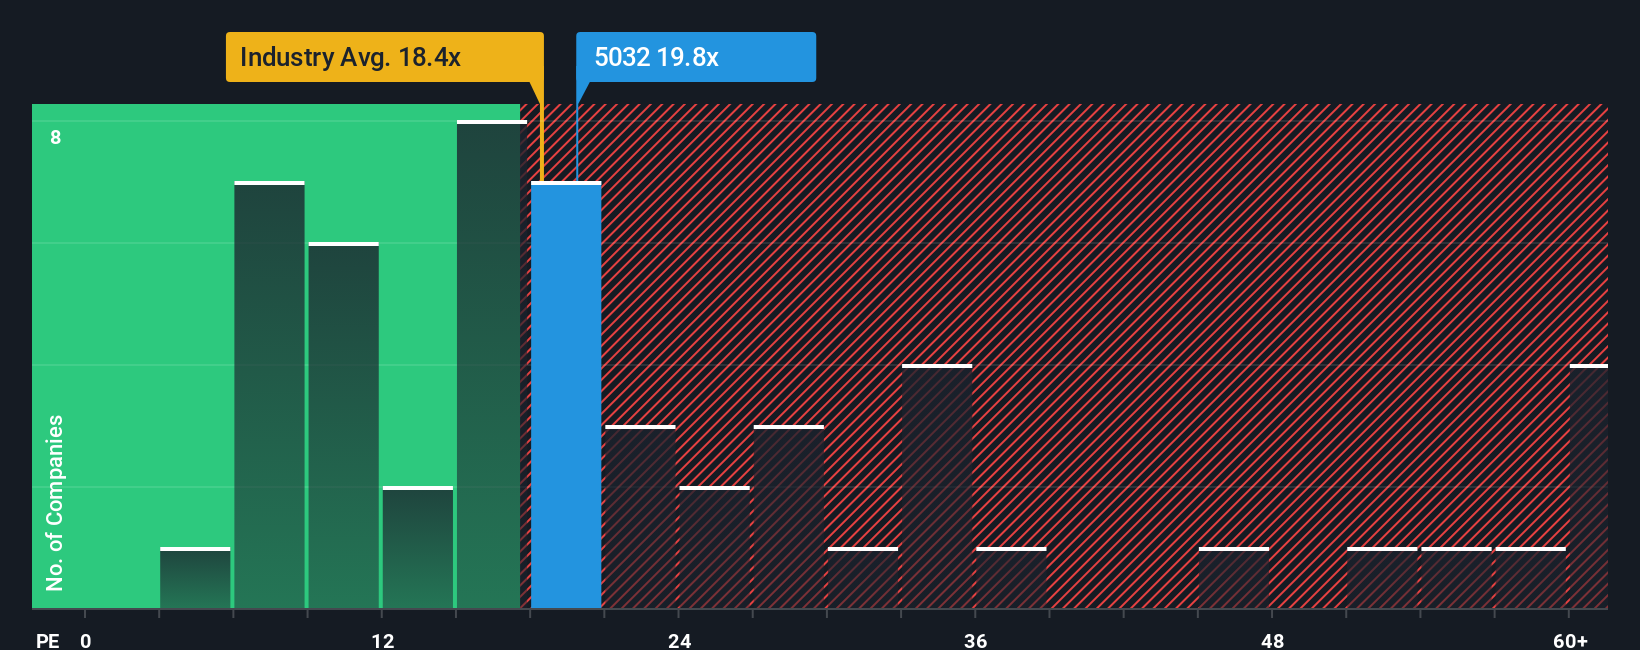
Price-to-Earnings of 19.8x: Is it justified?
ANYCOLOR looks inexpensive against its fundamentals, with our DCF fair value estimate at ¥6,804.51 versus a last close of ¥4,715, even though the stock screens slightly expensive on traditional earnings multiples versus the sector.
The price to earnings ratio compares what investors are paying today for each unit of current earnings, making it a useful yardstick for profitable entertainment and content businesses. In ANYCOLOR's case, a 19.8x multiple sits below our estimated fair P E of 24.9x and the peer average of 22.7x, which suggests the market may not be fully pricing in its strong margin profile and robust return on equity.
While the stock is marginally more expensive than the broader Japanese entertainment industry average of 18.5x, the gap is narrow, and the fair ratio work implies there is room for the market to move closer to a richer multiple if current growth and profitability trends persist.
Explore the SWS fair ratio for ANYCOLOR
Result: Price-to-Earnings of 19.8x (UNDERVALUED)
However, downside risk lingers if revenue and net income growth slow from low double digits, or if the December guidance underwhelms versus bullish expectations.
Find out about the key risks to this ANYCOLOR narrative.
Another View: What If The Market Is Right?
On raw earnings, ANYCOLOR screens slightly expensive versus the Japanese entertainment average at 19.8x versus 18.5x, even if it trades below peers and our fair ratio of 24.9x. That mixed picture hints at both upside and disappointment risk if growth sentiment shifts again.
See what the numbers say about this price — find out in our valuation breakdown.
Simply Wall St performs a discounted cash flow (DCF) on every stock in the world every day (check out ANYCOLOR for example). We show the entire calculation in full. You can track the result in your watchlist or portfolio and be alerted when this changes, or use our stock screener to discover 909 undervalued stocks based on their cash flows. If you save a screener we even alert you when new companies match - so you never miss a potential opportunity.
Build Your Own ANYCOLOR Narrative
If you see things differently or would rather dig into the numbers yourself, you can build a fresh view in just minutes: Do it your way.
A great starting point for your ANYCOLOR research is our analysis highlighting 4 key rewards and 1 important warning sign that could impact your investment decision.
Looking for your next move?
Before you call it a day, line up your next potential winners with a few targeted screens. These may help you identify candidates that could become tomorrow's strongest performers.
- Capture potential bargains by reviewing these 909 undervalued stocks based on cash flows that the market may be mispricing relative to their future cash flows and fundamentals.
- Ride structural growth trends by scanning these 30 healthcare AI stocks reshaping treatment, diagnostics, and patient outcomes with intelligent technology.
- Boost your income game by targeting these 13 dividend stocks with yields > 3% that combine meaningful yields with solid underlying businesses.
This article by Simply Wall St is general in nature. We provide commentary based on historical data and analyst forecasts only using an unbiased methodology and our articles are not intended to be financial advice. It does not constitute a recommendation to buy or sell any stock, and does not take account of your objectives, or your financial situation. We aim to bring you long-term focused analysis driven by fundamental data. Note that our analysis may not factor in the latest price-sensitive company announcements or qualitative material. Simply Wall St has no position in any stocks mentioned.
Have feedback on this article? Concerned about the content? Get in touch with us directly. Alternatively, email editorial-team@simplywallst.com