
- LIVE QUOTES
- LEARN
- HELP
 Nasdaq
 Wall Street Journal
EN
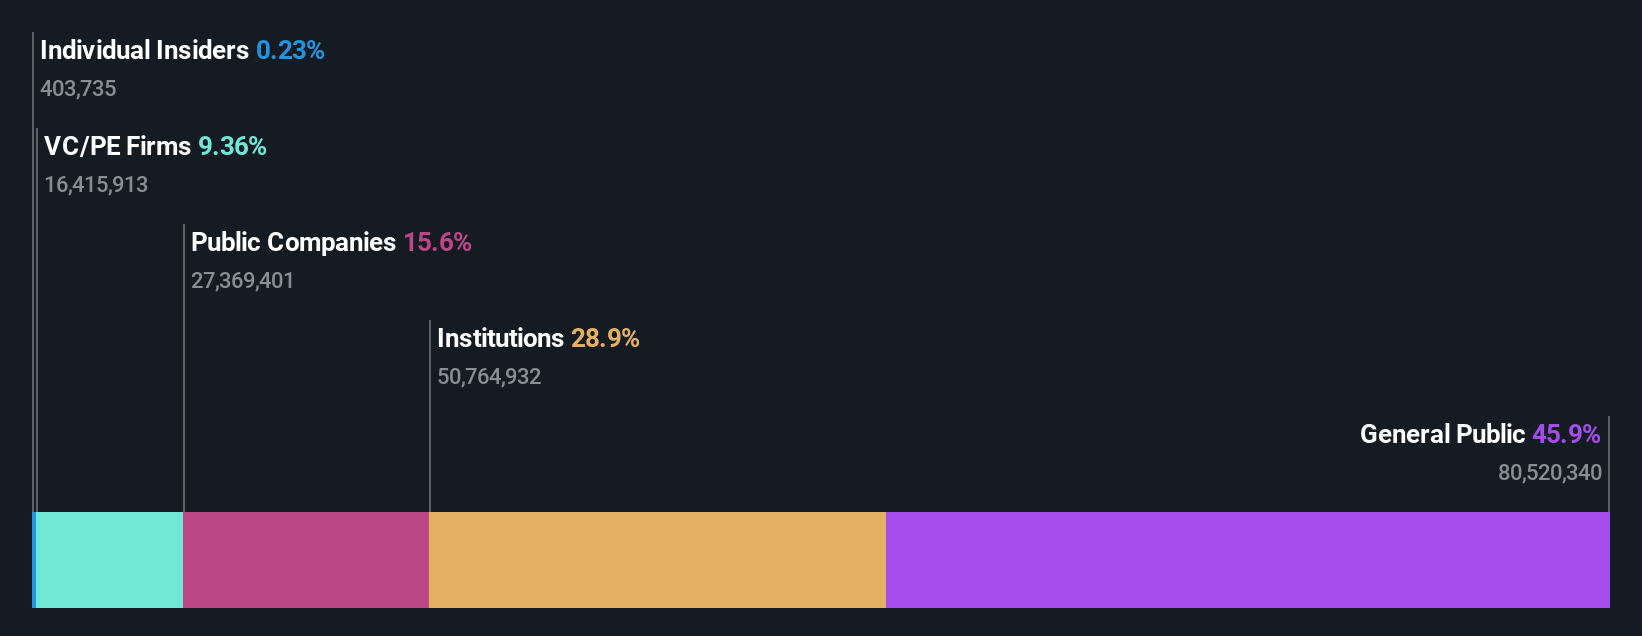
Institutions own 29% of Technip Energies N.V. (EPA:TE) shares but retail investors control 46% of the company
Key Insights
- Technip Energies' significant retail investors ownership suggests that the key decisions are influenced by shareholders from the larger public
- A total of 25 investors have a majority stake in the company with 47% ownership
- Recent sales by insiders
To get a sense of who is truly in control of Technip Energies N.V. (EPA:TE), it is important to understand the ownership structure of the business. We can see that retail investors own the lion's share in the company with 46% ownership. In other words, the group stands to gain the most (or lose the most) from their investment into the company.
Meanwhile, institutions make up 29% of the company’s shareholders. Large companies usually have institutions as shareholders, and we usually see insiders owning shares in smaller companies.
Let's take a closer look to see what the different types of shareholders can tell us about Technip Energies.
View our latest analysis for Technip Energies
What Does The Institutional Ownership Tell Us About Technip Energies?
Institutions typically measure themselves against a benchmark when reporting to their own investors, so they often become more enthusiastic about a stock once it's included in a major index. We would expect most companies to have some institutions on the register, especially if they are growing.
Technip Energies already has institutions on the share registry. Indeed, they own a respectable stake in the company. This can indicate that the company has a certain degree of credibility in the investment community. However, it is best to be wary of relying on the supposed validation that comes with institutional investors. They too, get it wrong sometimes. If multiple institutions change their view on a stock at the same time, you could see the share price drop fast. It's therefore worth looking at Technip Energies' earnings history below. Of course, the future is what really matters.

Technip Energies is not owned by hedge funds. The company's largest shareholder is HAL Trust, with ownership of 16%. Meanwhile, the second and third largest shareholders, hold 9.4% and 3.5%, of the shares outstanding, respectively.
Our studies suggest that the top 25 shareholders collectively control less than half of the company's shares, meaning that the company's shares are widely disseminated and there is no dominant shareholder.
While it makes sense to study institutional ownership data for a company, it also makes sense to study analyst sentiments to know which way the wind is blowing. Quite a few analysts cover the stock, so you could look into forecast growth quite easily.
Insider Ownership Of Technip Energies
While the precise definition of an insider can be subjective, almost everyone considers board members to be insiders. Company management run the business, but the CEO will answer to the board, even if he or she is a member of it.
Most consider insider ownership a positive because it can indicate the board is well aligned with other shareholders. However, on some occasions too much power is concentrated within this group.
Our most recent data indicates that insiders own less than 1% of Technip Energies N.V.. It is a pretty big company, so it would be possible for board members to own a meaningful interest in the company, without owning much of a proportional interest. In this case, they own around €13m worth of shares (at current prices). Arguably, recent buying and selling is just as important to consider. You can click here to see if insiders have been buying or selling.
General Public Ownership
The general public, who are usually individual investors, hold a 46% stake in Technip Energies. This size of ownership, while considerable, may not be enough to change company policy if the decision is not in sync with other large shareholders.
Private Equity Ownership
Private equity firms hold a 9.4% stake in Technip Energies. This suggests they can be influential in key policy decisions. Some investors might be encouraged by this, since private equity are sometimes able to encourage strategies that help the market see the value in the company. Alternatively, those holders might be exiting the investment after taking it public.
Public Company Ownership
It appears to us that public companies own 16% of Technip Energies. This may be a strategic interest and the two companies may have related business interests. It could be that they have de-merged. This holding is probably worth investigating further.
Next Steps:
I find it very interesting to look at who exactly owns a company. But to truly gain insight, we need to consider other information, too.
I like to dive deeper into how a company has performed in the past. You can access this interactive graph of past earnings, revenue and cash flow, for free.
But ultimately it is the future, not the past, that will determine how well the owners of this business will do. Therefore we think it advisable to take a look at this free report showing whether analysts are predicting a brighter future.
NB: Figures in this article are calculated using data from the last twelve months, which refer to the 12-month period ending on the last date of the month the financial statement is dated. This may not be consistent with full year annual report figures.
Have feedback on this article? Concerned about the content? Get in touch with us directly. Alternatively, email editorial-team (at) simplywallst.com.
This article by Simply Wall St is general in nature. We provide commentary based on historical data and analyst forecasts only using an unbiased methodology and our articles are not intended to be financial advice. It does not constitute a recommendation to buy or sell any stock, and does not take account of your objectives, or your financial situation. We aim to bring you long-term focused analysis driven by fundamental data. Note that our analysis may not factor in the latest price-sensitive company announcements or qualitative material. Simply Wall St has no position in any stocks mentioned.