
- LIVE QUOTES
- LEARN
- HELP
 Nasdaq
 Wall Street Journal
EN
Champions Oncology (CSBR) Q2 EPS Profit Supports Bullish High‑Quality Earnings Narrative
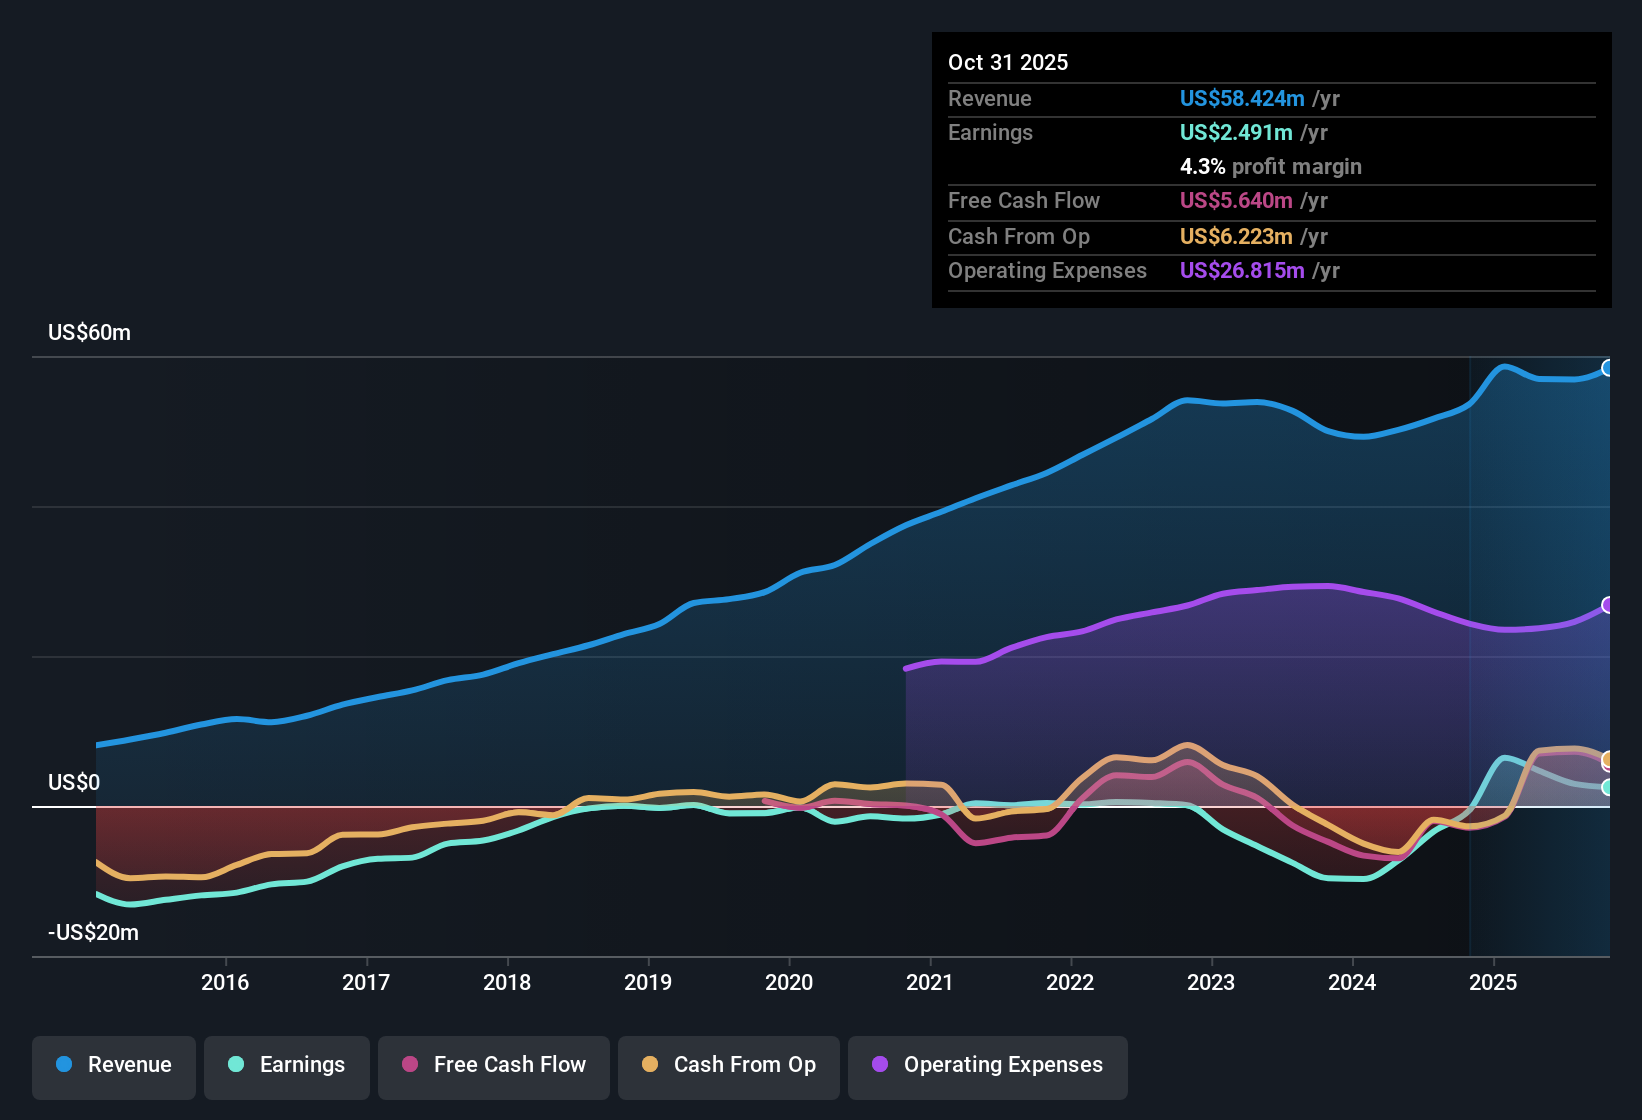
Champions Oncology (CSBR) has just posted Q2 2026 results with revenue of about $15.0 million and basic EPS of roughly $0.02, alongside net income of around $0.3 million, marking another data point in its recent profitability run. The company has seen quarterly revenue move from about $13.5 million in Q2 2025 to $15.0 million in Q2 2026, while EPS has swung from roughly $0.05 to $0.02 over the same stretch, setting the stage for investors to assess how sustainable its improving margin profile may be.
See our full analysis for Champions Oncology.With the latest figures on the table, the next step is to line these results up against the prevailing narratives around Champions Oncology to see which stories the numbers support and which ones they start to challenge.
Curious how numbers become stories that shape markets? Explore Community Narratives
9 percent revenue growth backs profitability turn
- Over the last 12 months, revenue reached about $58.4 million, up from roughly $53.6 million a year earlier, while net income for that trailing period came in at about $2.5 million instead of the loss of roughly $0.6 million shown a year ago.
- What stands out for a bullish view is that this 9 percent trailing revenue growth and the shift from a loss to $2.5 million of net income align with the idea of high quality earnings. However, the latest single quarter shows only $0.3 million of net income,
- Supporters pointing to five year earnings growth of 7.7 percent a year get some backing from the positive trailing 12 month profit, but they also have to factor in that quarterly EPS has bounced between positive and negative over the last six reported quarters.
- Bulls leaning on the description of high quality earnings can reference that profitability now extends across the full trailing 12 month window, not just an isolated quarter. Even so, individual quarters like Q1 2026 still reported a loss of about $0.4 million.
TTM EPS of $0.18 versus choppy quarterly pattern
- Trailing 12 month basic EPS stands at about $0.18, whereas the last six individual quarters range from a high of roughly $0.33 in Q3 2025 to a low of around negative $0.13 in Q4 2025, with Q2 2026 landing close to flat at about $0.02.
- For a bullish interpretation, the move from negative trailing EPS of about negative $0.25 at the start of 2025 to positive $0.18 by Q2 2026 supports the idea that profitability is now more than a one off,
- At the same time, the step down from trailing EPS of about $0.47 at Q3 2025 to $0.18 by Q2 2026 reminds investors that the path to sustained profit has included some sizable swings.
- This mix of positive trailing EPS and volatile quarterly numbers means any bullish case built on stable compounding still has to be tested against how wide those quarter to quarter EPS moves have been.
Valuation sits between peers and DCF fair value
- With the share price at $6.73 and a trailing P E of about 37.5 times, the stock trades slightly above the broader North American life sciences industry average multiple of roughly 35.9 times but below the peer group at about 52.4 times, and well under a DCF fair value of about $13.25.
- From a bearish angle, critics highlight that expected revenue growth of about 9 percent lags the 10.6 percent pace cited for the wider US market, and that paying a P E above the industry average for slower growth may be hard to justify even if the price is almost 49 percent below the DCF fair value,
- This tension between a discount to DCF fair value and a premium to the industry multiple means bears can still argue that the market is pricing in some of the profitability shift already despite growth running behind the broader market.
- However, the combination of positive trailing net income of roughly $2.5 million and a multiple that is below immediate peers gives investors a concrete set of numbers to weigh against concerns about the slower growth rate.
Next Steps
Don't just look at this quarter; the real story is in the long-term trend. We've done an in-depth analysis on Champions Oncology's growth and its valuation to see if today's price is a bargain. Add the company to your watchlist or portfolio now so you don't miss the next big move.
See What Else Is Out There
Champions Oncology’s uneven quarterly earnings and revenue growth, alongside a premium multiple to a slower growing market, raise questions about the reliability of its trajectory.
If that volatility makes you uneasy, use our stable growth stocks screener ( results) to quickly focus on companies delivering steadier revenue and earnings trends that can anchor a more predictable portfolio.
This article by Simply Wall St is general in nature. We provide commentary based on historical data and analyst forecasts only using an unbiased methodology and our articles are not intended to be financial advice. It does not constitute a recommendation to buy or sell any stock, and does not take account of your objectives, or your financial situation. We aim to bring you long-term focused analysis driven by fundamental data. Note that our analysis may not factor in the latest price-sensitive company announcements or qualitative material. Simply Wall St has no position in any stocks mentioned.
Have feedback on this article? Concerned about the content? Get in touch with us directly. Alternatively, email editorial-team@simplywallst.com