
- LIVE QUOTES
- LEARN
- HELP
 Nasdaq
 Wall Street Journal
EN
Does The Recent 25.6% Slide in Elastic Present a Long Term Opportunity?
- If you are wondering whether Elastic is a beaten down opportunity or a value trap at current levels, you are not alone. This piece will unpack that question.
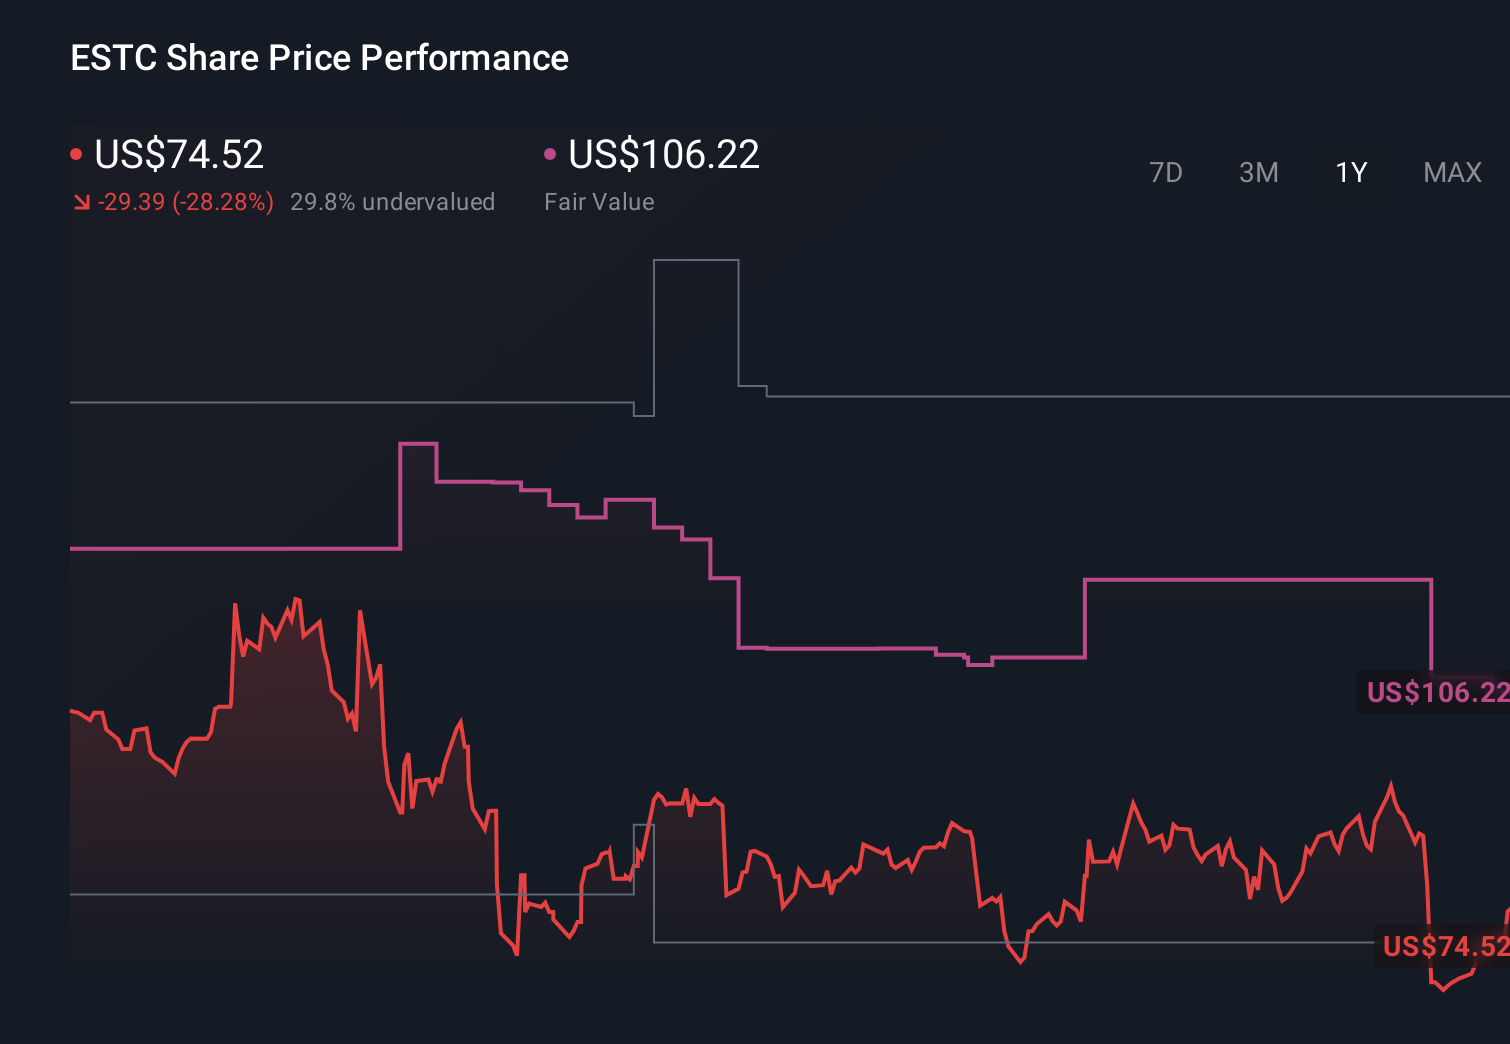
- After a choppy stretch, the stock is down 2.4% over the last week, 18.8% over the last month, and 25.6% year to date, while still being up 40.1% over three years.
- That mix of long term gains and recent weakness comes against a backdrop of steady adoption of Elastic's search and observability platform, as businesses continue to rely on data driven tools for security and performance. Investors have also been digesting shifting sentiment around high growth software names generally, which can amplify swings in Elastic's share price even when its own story does not change significantly.
- Our Simply Wall St Valuation score currently sits at 4/6. This suggests the stock screens as undervalued on most, but not all, of our checks. In the next sections we will walk through those valuation methods and finish with what may be an even better way to think about Elastic's worth.
Find out why Elastic's -29.5% return over the last year is lagging behind its peers.
Approach 1: Elastic Discounted Cash Flow (DCF) Analysis
A Discounted Cash Flow model takes the cash Elastic is expected to generate in the future and then discounts those projections back into today’s dollars to estimate what the business is worth now.
Elastic currently generates about $302.2 million in free cash flow. Analyst forecasts combined with Simply Wall St extrapolations see this rising steadily to roughly $1.0 billion by 2035. The projections step up through the late 2020s, with discounted free cash flows in the mid to high hundreds of millions of dollars each year as the company scales its platform.
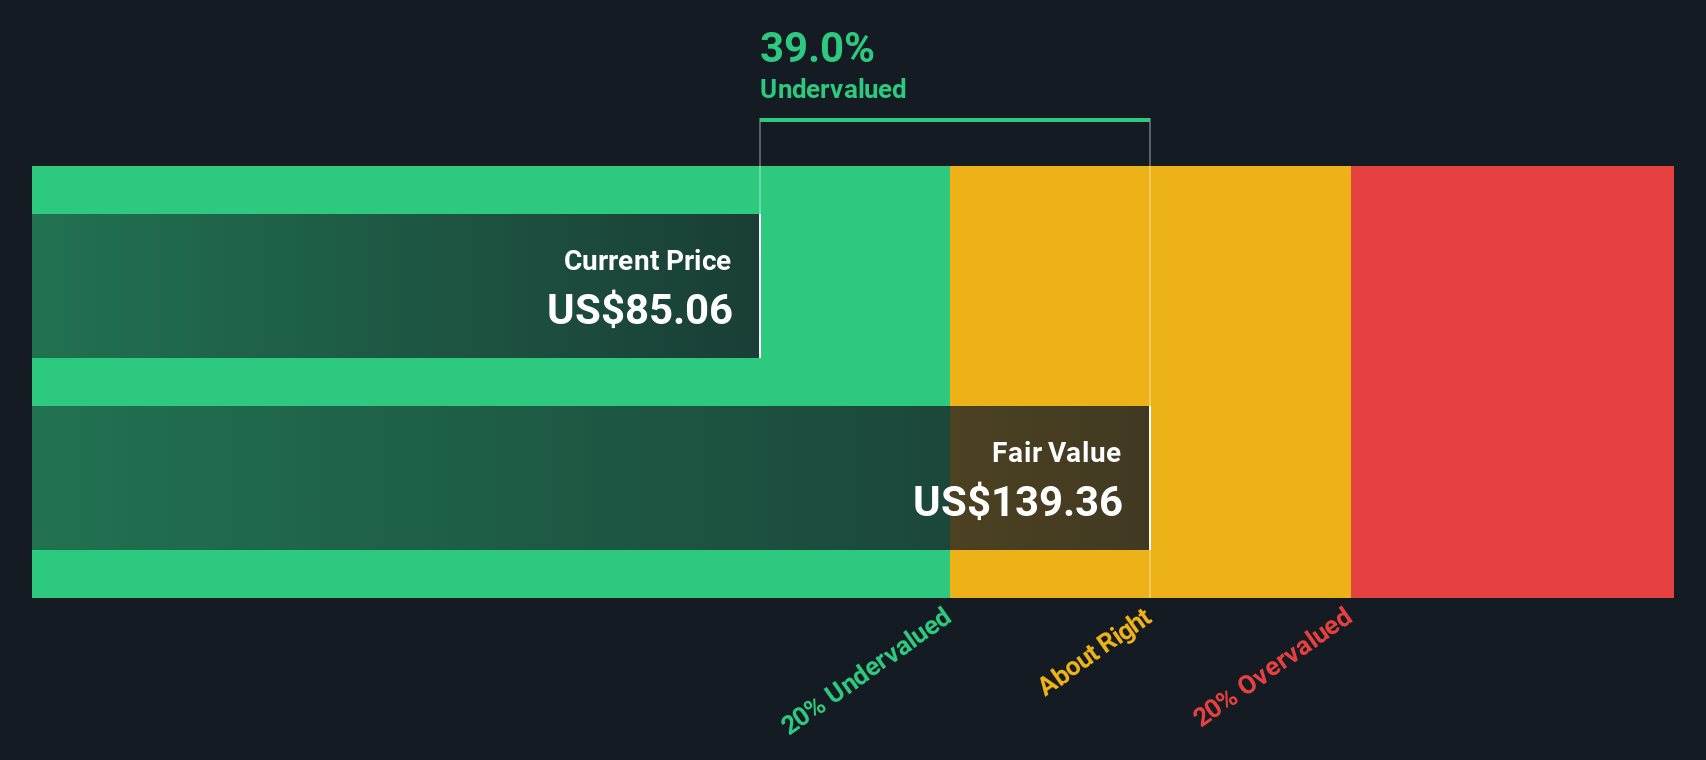
Using a 2 Stage Free Cash Flow to Equity approach, these future cash flows imply an intrinsic value of around $135.19 per share. Compared to the current share price, this DCF indicates that Elastic is trading at roughly a 45.5% discount to its estimated fair value, which screens as meaningfully undervalued on this model.
Result: UNDERVALUED
Our Discounted Cash Flow (DCF) analysis suggests Elastic is undervalued by 45.5%. Track this in your watchlist or portfolio, or discover 913 more undervalued stocks based on cash flows.
Approach 2: Elastic Price vs Sales
For a business like Elastic that is still prioritising growth and reinvestment, revenue based metrics such as the price to sales ratio are often more informative than earnings, because they are less distorted by near term spending and accounting adjustments.
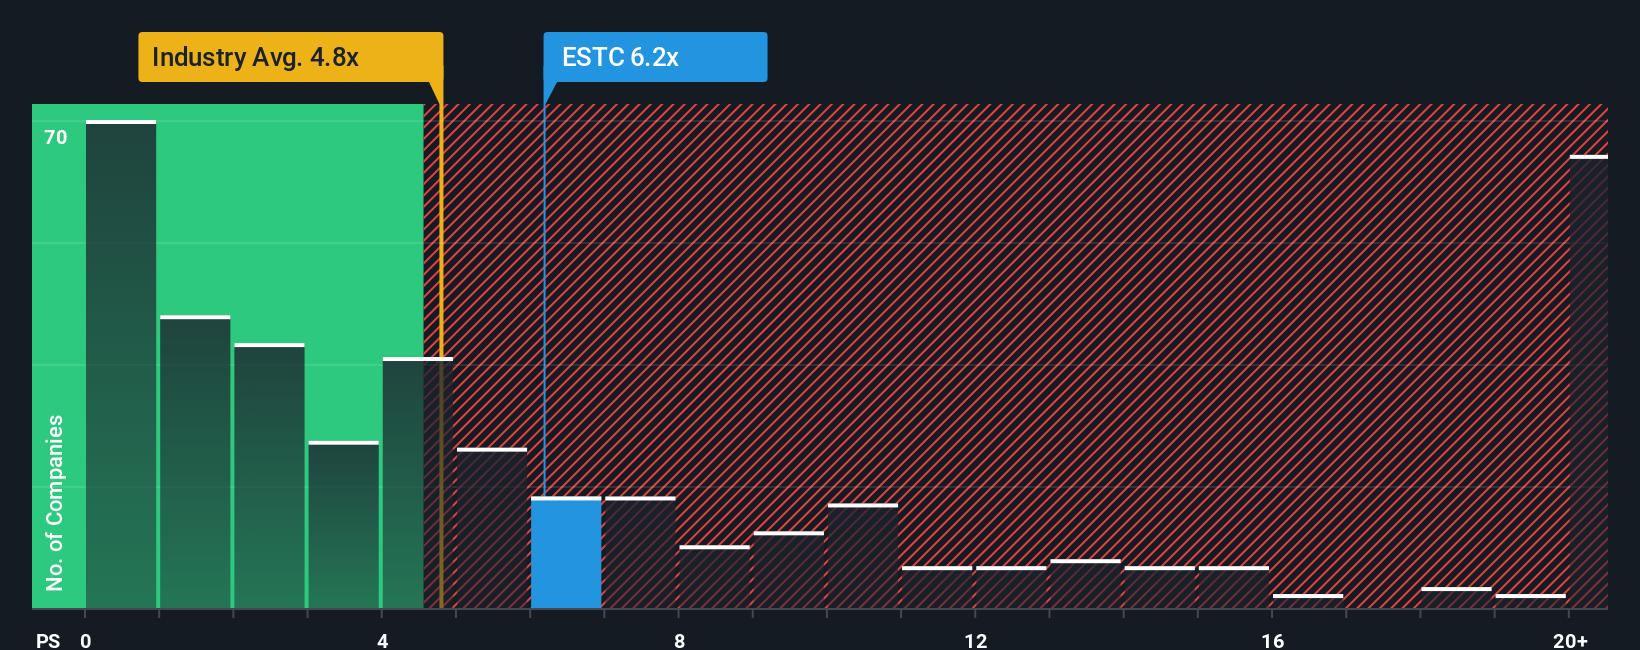
In general, faster growing and less risky software companies can justify higher sales multiples, while slower or more volatile names tend to trade closer to, or even below, the industry norm. Elastic currently trades on a price to sales multiple of 4.83x, which is almost identical to the broader Software industry average of about 4.81x, but meaningfully below the peer group average of roughly 7.76x that often includes higher flying growth stories.
Simply Wall St’s Fair Ratio metric estimates what a reasonable price to sales multiple should be, after adjusting for Elastic’s specific growth outlook, profitability profile, risk factors, size, and industry. That makes it more tailored than a simple comparison to peers or the sector, which can overlook important differences in quality and risk. For Elastic, the Fair Ratio is 6.38x, comfortably above the current 4.83x valuation, suggesting the market is not fully pricing in its fundamentals on this measure.
Result: UNDERVALUED
PS ratios tell one story, but what if the real opportunity lies elsewhere? Discover 1455 companies where insiders are betting big on explosive growth.
Upgrade Your Decision Making: Choose your Elastic Narrative
Earlier we mentioned that there is an even better way to understand valuation, so let us introduce you to Narratives, a simple way to connect your view of a company’s story with the numbers by turning your assumptions about Elastic’s future revenue, earnings and margins into a forecast and then a Fair Value that you can compare to today’s price. On Simply Wall St, millions of investors build Narratives on the Community page, where each Narrative clearly links a qualitative thesis, like GenAI driven upside or intensifying competition, to a quantified outlook and a live Fair Value that updates automatically as new earnings, news and guidance arrive. Narratives then help you decide how to act by showing whether your Fair Value sits above or below the current market price, and by how much, based on the specific story you believe. For example, one Elastic Narrative might assume strong GenAI adoption, cloud migration and margin expansion and therefore support a Fair Value closer to the most bullish $143 target. A more cautious Narrative might lean on slower growth, rising competition and thinner margins, landing nearer the most bearish $92 view.
Do you think there's more to the story for Elastic? Head over to our Community to see what others are saying!
This article by Simply Wall St is general in nature. We provide commentary based on historical data and analyst forecasts only using an unbiased methodology and our articles are not intended to be financial advice. It does not constitute a recommendation to buy or sell any stock, and does not take account of your objectives, or your financial situation. We aim to bring you long-term focused analysis driven by fundamental data. Note that our analysis may not factor in the latest price-sensitive company announcements or qualitative material. Simply Wall St has no position in any stocks mentioned.
Have feedback on this article? Concerned about the content? Get in touch with us directly. Alternatively, email editorial-team@simplywallst.com