
- LIVE QUOTES
- LEARN
- HELP
 Nasdaq
 Wall Street Journal
EN
Assessing Sprott (TSX:SII) Valuation After Its Silver ETF Surpasses $500 Million in Assets Under Management
Sprott (TSX:SII) just hit a milestone with its Silver Miners and Physical Silver ETF, which has climbed to 500 million dollars in assets under management in under a year, supported by rising silver prices.
See our latest analysis for Sprott.
That surge in ETF assets has coincided with strong momentum in Sprott’s own shares, with a 90 day share price return of 32.63 percent and a 1 year total shareholder return of 116.49 percent, suggesting investors are leaning into the growth story rather than fading it.
If Sprott’s run has you thinking about what else might be gaining traction, you can broaden your search and discover fast growing stocks with high insider ownership.
With the shares now trading slightly above the average analyst target and recent gains already spectacular, the question is whether Sprott is still mispriced by the market or if investors are already paying upfront for years of future growth.
Price to Earnings of 48.5x: Is It Justified?
Sprott’s shares last closed at CA$130.30, a level that corresponds to a rich price-to-earnings ratio of 48.5 times, well above typical market benchmarks.
The price-to-earnings multiple compares what investors are willing to pay today to the company’s current earnings. It is a common yardstick for asset managers with established profit streams. At 48.5 times earnings, the market is effectively attaching a premium to Sprott’s ability to turn its growing AUM into future profits.
Some of that premium can be tied back to the company’s track record, with earnings having grown by about 15.9 percent per year over the past five years, even if last year’s 6.4 percent growth marked a slowdown and net profit margins slipped from 26.8 percent to 23.3 percent. Revenue is still expected to grow at about 10.4 percent per year, faster than the broader Canadian market, and return on equity is forecast to climb from a currently modest 13.7 percent to 21.3 percent in three years. This helps explain why investors may be paying up for each dollar of earnings.
Relative to peers, however, the gap is stark. Sprott’s 48.5 times earnings multiple stands far above both the Canadian capital markets industry average of 8.9 times and the peer group average of 24.4 times. This signals that the stock is priced as a standout growth and profitability story rather than a typical sector player.
See what the numbers say about this price — find out in our valuation breakdown.
Result: Price-to-Earnings of 48.5x (OVERVALUED)
However, a sharp reversal in silver prices or weaker than expected fund inflows could quickly compress Sprott’s premium multiple and cool sentiment.
Find out about the key risks to this Sprott narrative.
Another Angle on Valuation
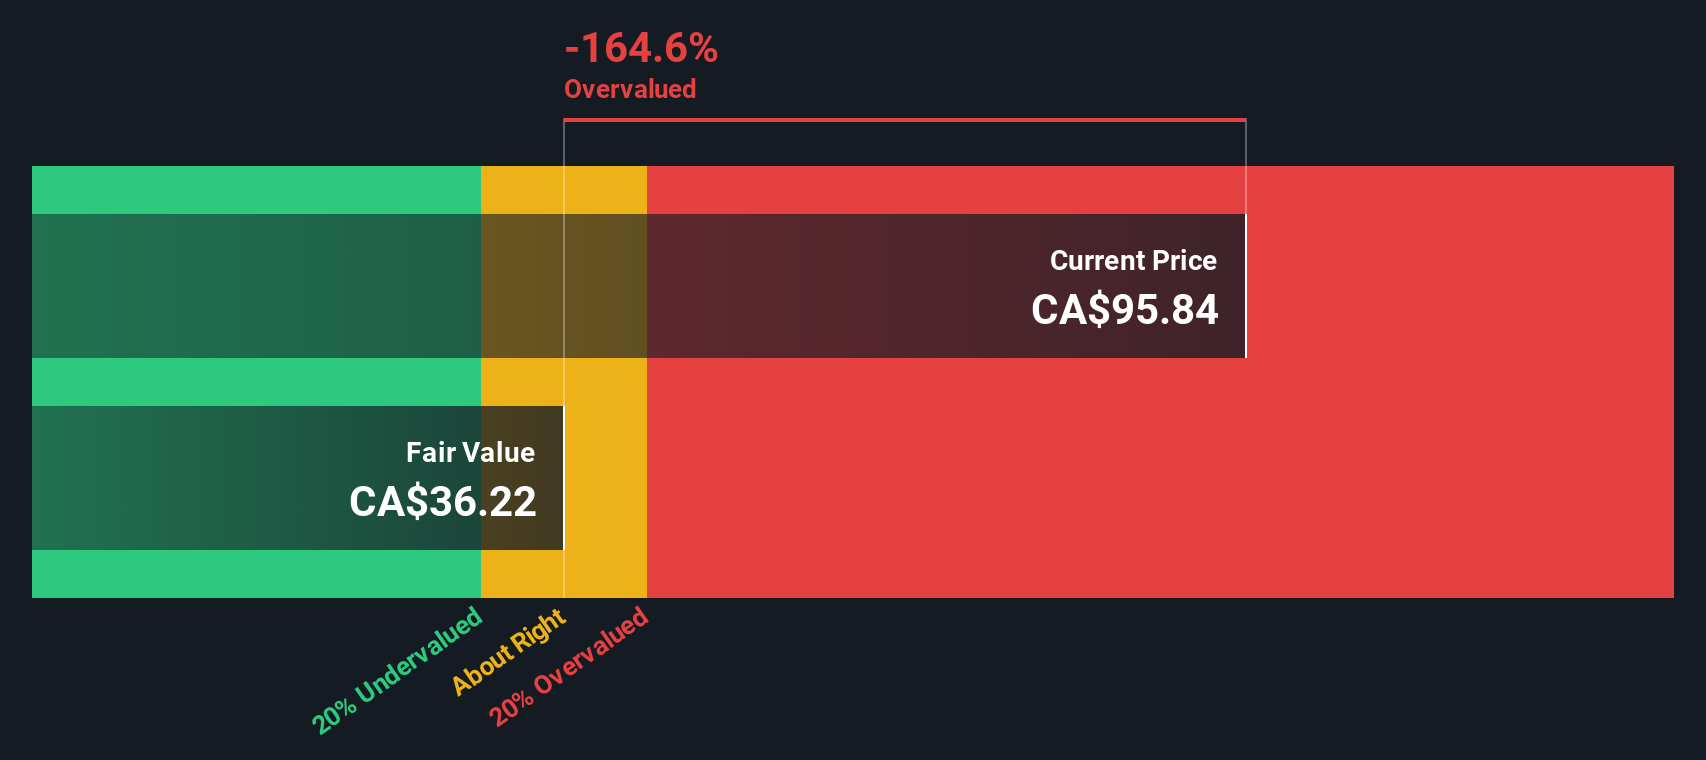
Our SWS DCF model paints a very different picture, suggesting Sprott’s fair value sits closer to CA$38.88 per share, well below today’s CA$130.30. If the cash flow assumptions are right, is the market ignoring downside risk or correctly pricing in a much richer future?
Look into how the SWS DCF model arrives at its fair value.
Simply Wall St performs a discounted cash flow (DCF) on every stock in the world every day (check out Sprott for example). We show the entire calculation in full. You can track the result in your watchlist or portfolio and be alerted when this changes, or use our stock screener to discover 906 undervalued stocks based on their cash flows. If you save a screener we even alert you when new companies match - so you never miss a potential opportunity.
Build Your Own Sprott Narrative
If you see the numbers differently or want to dig into the details yourself, you can build a custom view in just a few minutes: Do it your way.
A good starting point is our analysis highlighting 2 key rewards investors are optimistic about regarding Sprott.
Ready for more investment ideas?
Before markets move on without you, use the Simply Wall St Screener to uncover targeted opportunities that match your strategy and sharpen your next move.
- Capitalize on high-yield income potential by reviewing these 13 dividend stocks with yields > 3% that can strengthen your portfolio’s cash flow.
- Position yourself for the next wave of innovation by scanning these 26 AI penny stocks at the forefront of artificial intelligence breakthroughs.
- Seize value opportunities early by focusing on these 906 undervalued stocks based on cash flows that may be mispriced relative to their future cash flows.
This article by Simply Wall St is general in nature. We provide commentary based on historical data and analyst forecasts only using an unbiased methodology and our articles are not intended to be financial advice. It does not constitute a recommendation to buy or sell any stock, and does not take account of your objectives, or your financial situation. We aim to bring you long-term focused analysis driven by fundamental data. Note that our analysis may not factor in the latest price-sensitive company announcements or qualitative material. Simply Wall St has no position in any stocks mentioned.
Have feedback on this article? Concerned about the content? Get in touch with us directly. Alternatively, email editorial-team@simplywallst.com