
- LIVE QUOTES
- LEARN
- HELP
 Nasdaq
 Wall Street Journal
EN
Is It Too Late To Consider Robinhood After Its 1,323% Three Year Surge?
- If you are wondering whether Robinhood Markets is still attractive after its massive run, or if you are too late to the party, you are in the right place to unpack what the current price might really be worth.
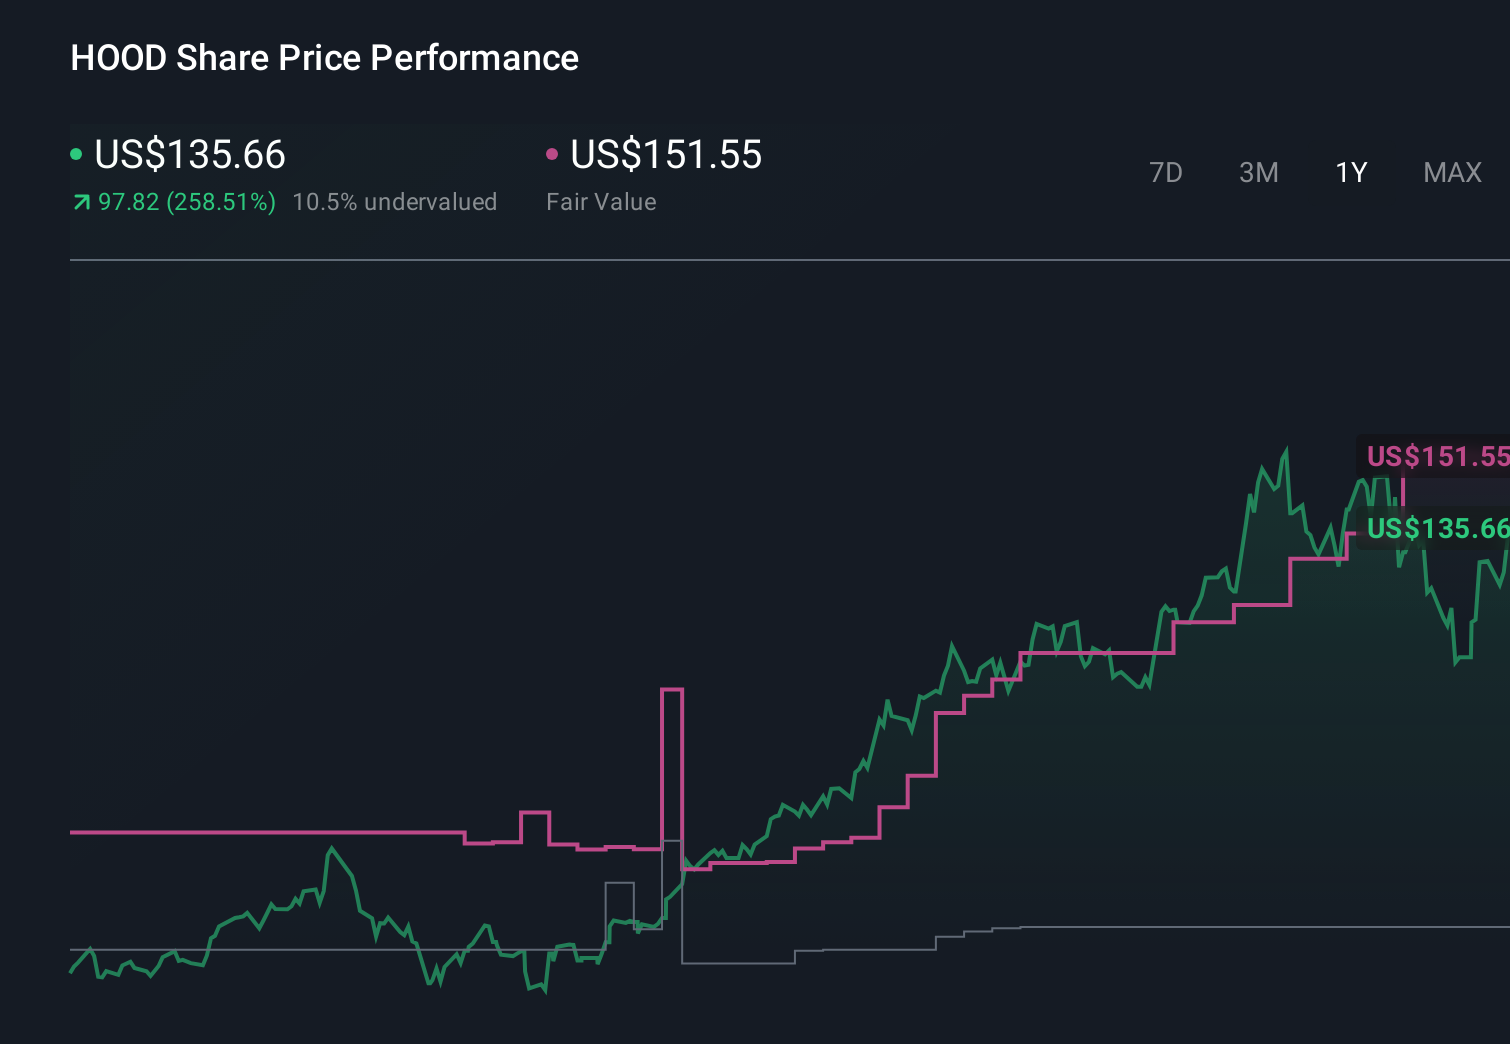
- The stock has cooled off recently, down 15.1% over the last week and 5.9% over the last month, but it is still up an eye‑catching 192.2% year to date and 176.9% over the last year, with a staggering 1,323.0% gain over three years.
- Those moves have come as investors focus on Robinhood's expanding product lineup, including options, crypto, and retirement accounts, and the platform's role as a gateway for a new generation of retail traders. At the same time, shifting sentiment around trading activity, interest rates, and regulation has kept debate alive on whether the market is overreacting or finally catching up to its long‑term potential.
- Despite all that excitement, Robinhood only scores 1 out of 6 on our valuation checks, suggesting it screens as undervalued on just one metric. In this article, we break down what different valuation methods say about the stock and finish with a more nuanced way to think about value than simple multiples or models alone.
Robinhood Markets scores just 1/6 on our valuation checks. See what other red flags we found in the full valuation breakdown.
Approach 1: Robinhood Markets Excess Returns Analysis
The Excess Returns model asks a simple question: how much profit can Robinhood Markets generate on its equity above the return investors demand, and for how long? It starts with the current Book Value of $9.53 per share and a Stable EPS of $2.61 per share, based on weighted future Return on Equity estimates from 8 analysts.
With an Average Return on Equity of 20.72% and a Cost of Equity of $1.06 per share, the model estimates an Excess Return of $1.54 per share. That excess is then capitalized over time using a Stable Book Value of $12.57 per share, sourced from weighted future Book Value estimates from 5 analysts, to arrive at an implied intrinsic value.
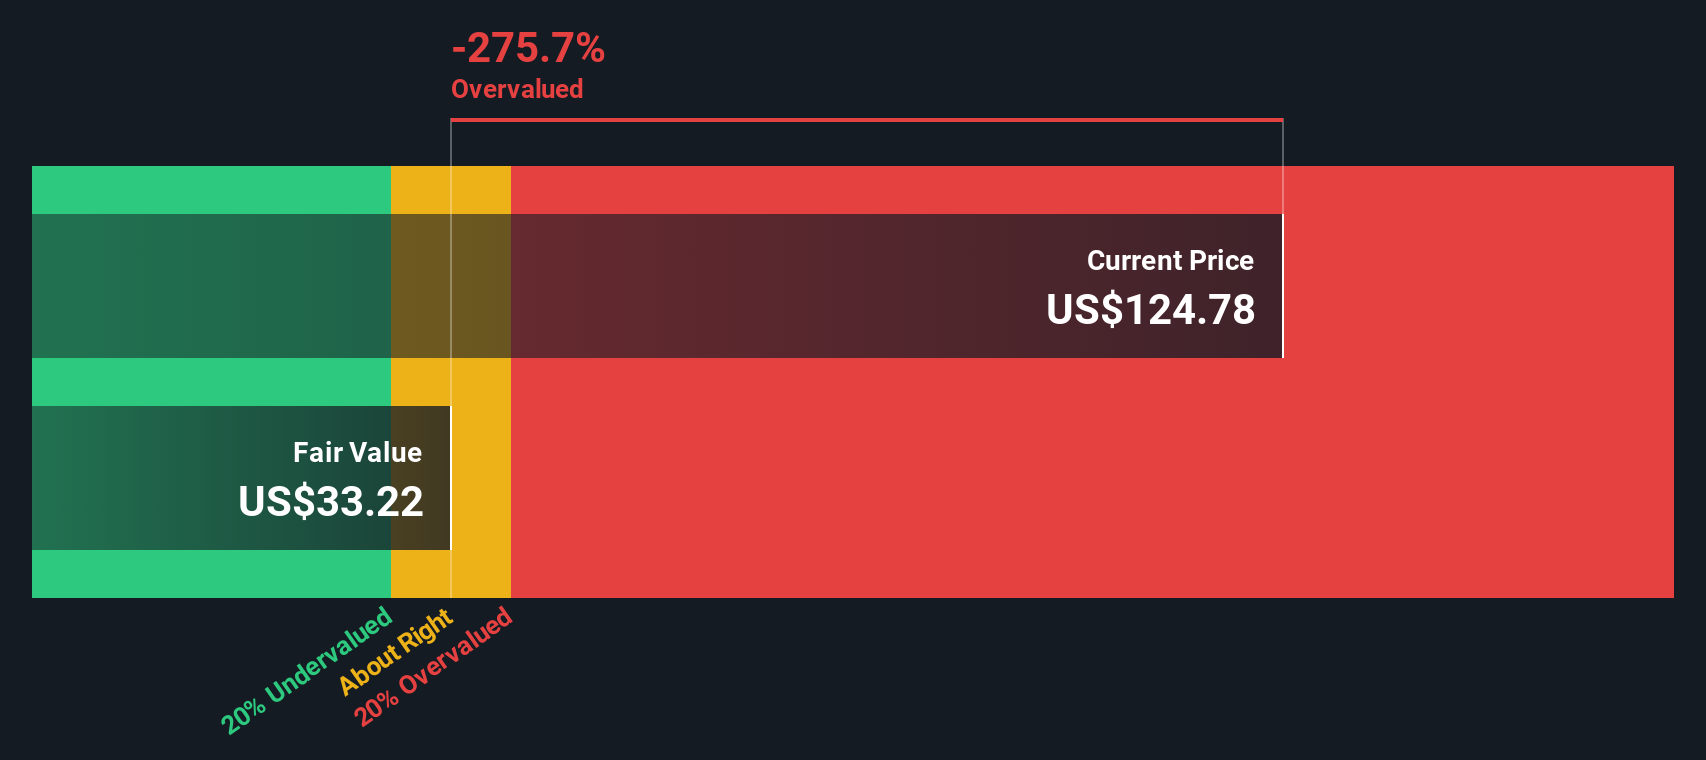
For Robinhood, this Excess Returns valuation suggests the shares are trading about 173.1% above their intrinsic value, indicating a materially overvalued stock relative to the earnings power implied by its equity base and expected profitability.
Result: OVERVALUED
Our Excess Returns analysis suggests Robinhood Markets may be overvalued by 173.1%. Discover 906 undervalued stocks or create your own screener to find better value opportunities.
Approach 2: Robinhood Markets Price vs Earnings
For profitable companies like Robinhood, the price to earnings (PE) ratio is a useful yardstick because it links what investors are paying directly to the profits the business is generating today. In general, faster growth and lower perceived risk justify a higher PE, while slower or more uncertain earnings streams deserve a lower multiple.
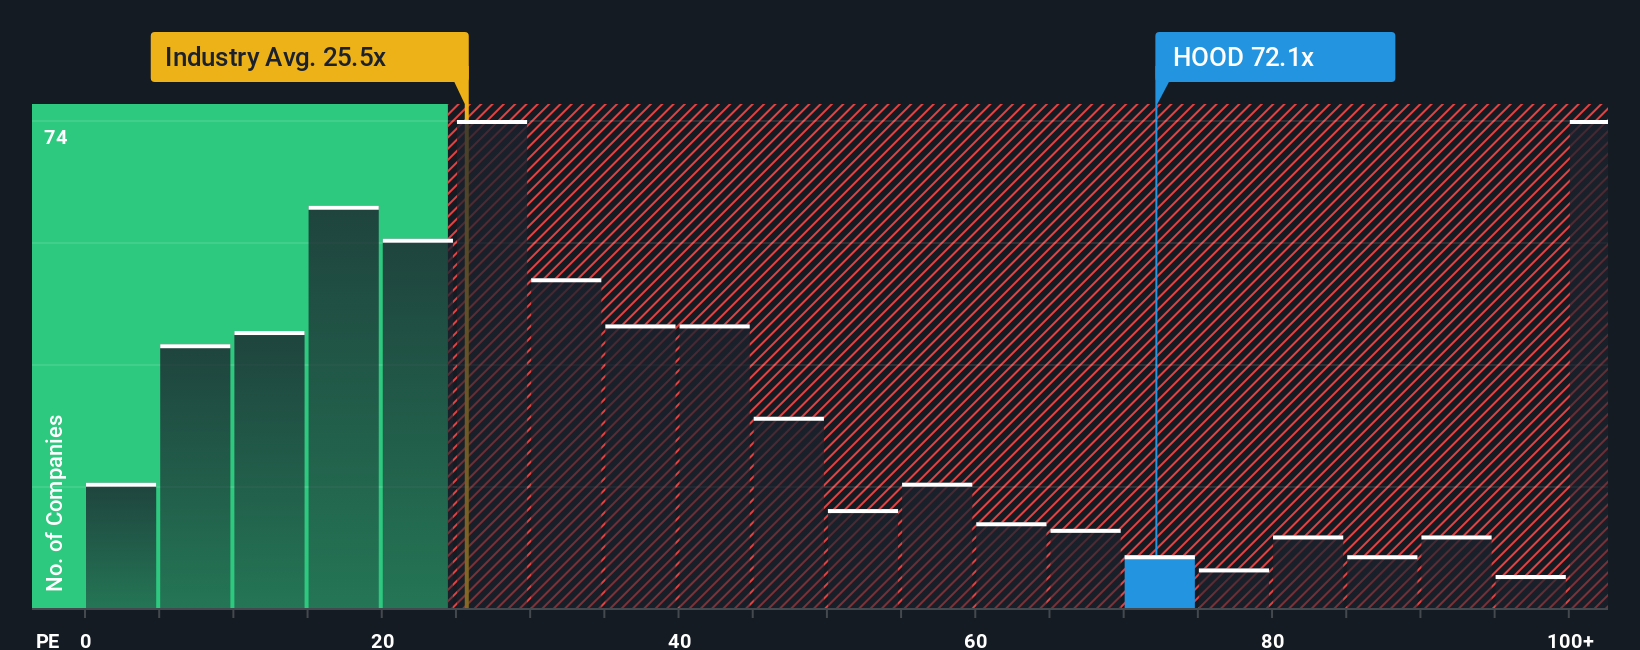
Robinhood currently trades on a PE of about 47.24x, which is well above both the Capital Markets industry average of roughly 25.02x and the peer average of 22.04x. On the surface, that premium suggests the market is baking in robust growth and a relatively optimistic outlook compared with other players in the space.
Simply Wall St’s Fair Ratio framework goes a step further by estimating what a reasonable PE should be after accounting for Robinhood’s earnings growth prospects, industry dynamics, profit margins, market cap, and company specific risks. For Robinhood, this Fair Ratio comes out at 27.03x, meaning the current 47.24x multiple sits materially above what those fundamentals would justify, pointing to a stretched valuation on a PE basis.
Result: OVERVALUED
PE ratios tell one story, but what if the real opportunity lies elsewhere? Discover 1449 companies where insiders are betting big on explosive growth.
Upgrade Your Decision Making: Choose your Robinhood Markets Narrative
Earlier we mentioned that there is an even better way to understand valuation. On Simply Wall St that is through Narratives, which let you connect your view of a company’s story to a set of explicit forecasts for revenue, earnings and margins, and then to a Fair Value estimate you can compare with today’s price to decide whether to buy, hold, or sell.
A Narrative is a structured story behind the numbers, created on the Community page and used by millions of investors. In a Narrative you spell out how you believe Robinhood will grow, what margins it can sustain, and what risks matter most, and the platform turns that into a dynamic valuation that automatically updates as new earnings, news, or guidance arrive.
For Robinhood, one investor might build a bullish Narrative that leans into prediction markets, the MIAXdx venture, AI driven product expansion and international growth, and arrive at a Fair Value closer to the upper end of recent targets around $160. A more cautious investor might instead focus on regulatory uncertainty, competition and margin pressure, and land nearer the low end around $50. The power of Narratives is that both perspectives are made explicit, comparable, and easy to track over time.
Do you think there's more to the story for Robinhood Markets? Head over to our Community to see what others are saying!
This article by Simply Wall St is general in nature. We provide commentary based on historical data and analyst forecasts only using an unbiased methodology and our articles are not intended to be financial advice. It does not constitute a recommendation to buy or sell any stock, and does not take account of your objectives, or your financial situation. We aim to bring you long-term focused analysis driven by fundamental data. Note that our analysis may not factor in the latest price-sensitive company announcements or qualitative material. Simply Wall St has no position in any stocks mentioned.
Have feedback on this article? Concerned about the content? Get in touch with us directly. Alternatively, email editorial-team@simplywallst.com