
- LIVE QUOTES
- LEARN
- HELP
 Nasdaq
 Wall Street Journal
EN
Is Metaplanet’s Soaring Multi Year Return Still Justified After Recent Pullback?
- If you are wondering whether Metaplanet is still a smart bet or if the best days are already priced in, you are not alone. That is exactly what this breakdown will tackle.
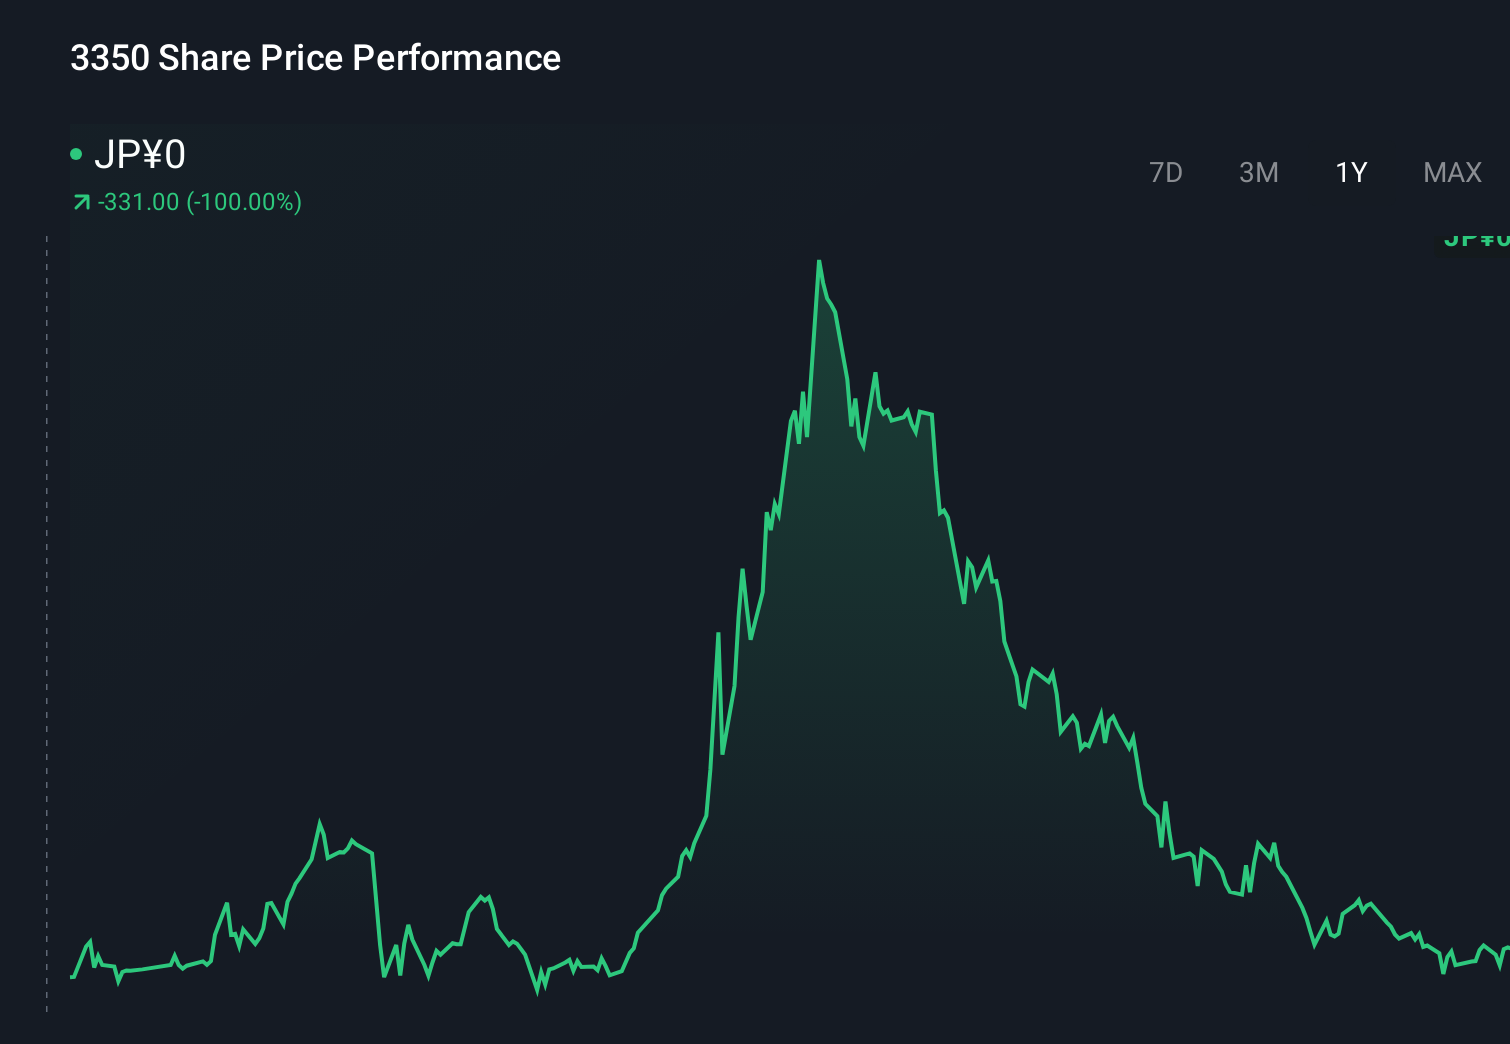
- The stock has cooled off recently, down 5.2% over the last week and slightly negative over the last month, but that comes after a multi year run with returns of 729.2% over 3 years and 586.2% over 5 years, plus an 11.3% gain year to date.
- Those kinds of swings usually follow a mix of shifting investor sentiment and headline driven excitement, from speculation about the company’s strategic direction to broader market narratives around high growth names in Japan. Even without a single defining news catalyst this month, Metaplanet tends to move when risk appetite changes across the market, which is important context for any valuation call.
- Right now Metaplanet scores just 2/6 on our undervaluation checks. We will walk through what the main valuation approaches say about the stock and then finish with a more complete way to judge whether the current price really makes sense.
Metaplanet scores just 2/6 on our valuation checks. See what other red flags we found in the full valuation breakdown.
Approach 1: Metaplanet Discounted Cash Flow (DCF) Analysis
A Discounted Cash Flow model estimates what a company is worth by projecting the cash it can generate in the future and then discounting those ¥ figures back to today. For Metaplanet, the model starts with last twelve month free cash flow of about ¥1.9 Billion and then applies a two stage growth profile.
Analyst style estimates extend to 2035, with free cash flow expected to rise gradually from around ¥2.1 Billion in 2026 to roughly ¥2.5 Billion in 2035. Each of these future cash flows is discounted back to present value to reflect risk and the time value of money, and Simply Wall St extrapolates the outer year projections beyond the typical five year analyst horizon.
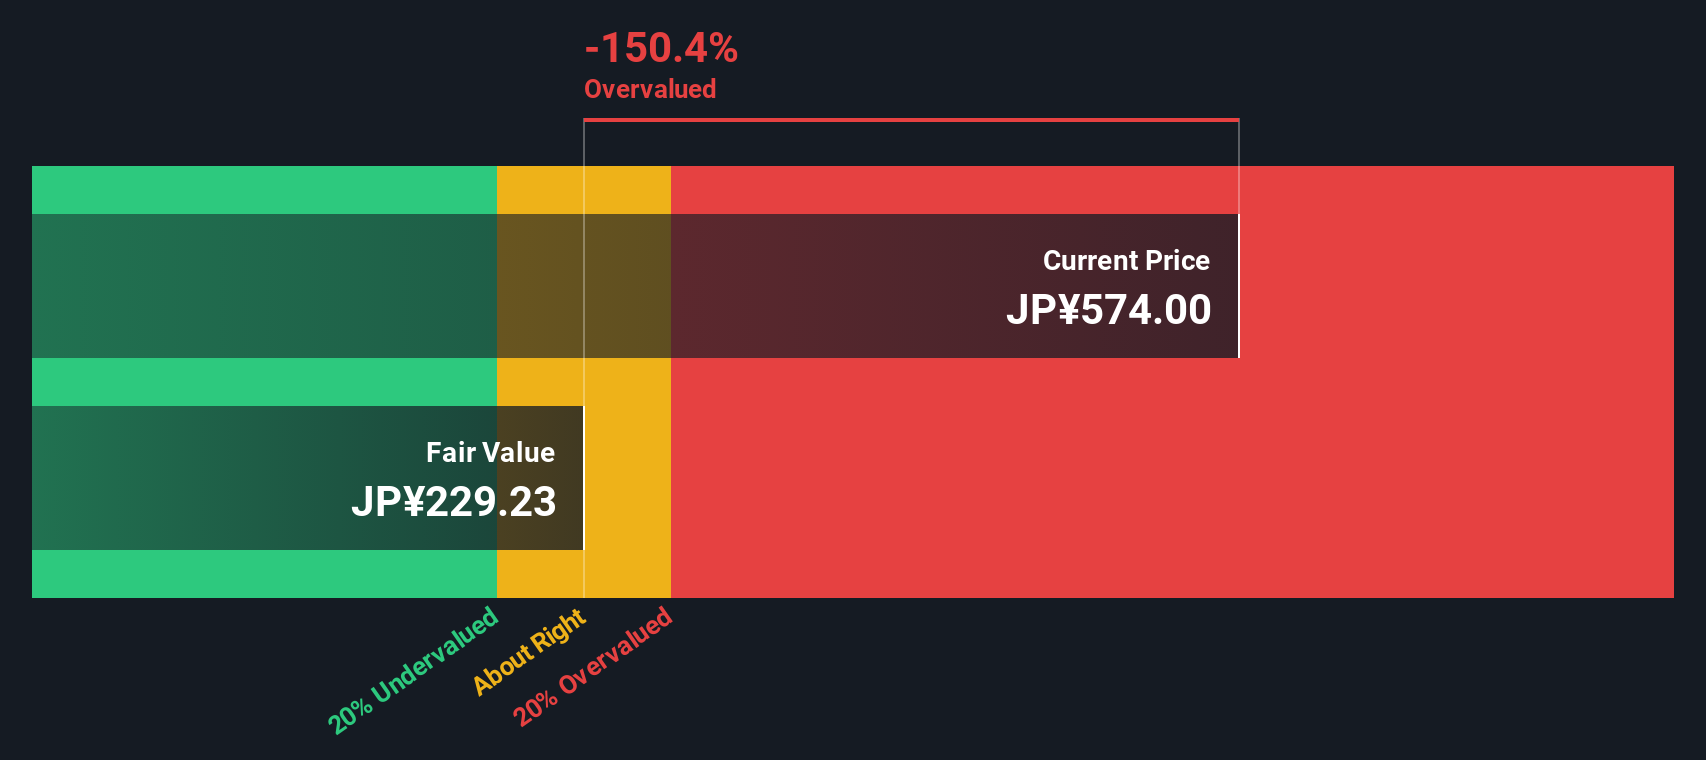
Putting all these discounted cash flows together, the DCF model arrives at an intrinsic value of about ¥35.51 per share. Compared with the current share price, this implies the stock is 1020.9% above its DCF fair value, indicating that the market is pricing in far more optimism than the cash flow analysis supports.
Result: OVERVALUED
Our Discounted Cash Flow (DCF) analysis suggests Metaplanet may be overvalued by 1020.9%. Discover 903 undervalued stocks or create your own screener to find better value opportunities.
Approach 2: Metaplanet Price vs Earnings
For profitable companies like Metaplanet, the price to earnings ratio is a straightforward way to gauge how much investors are willing to pay for each unit of current earnings. A higher PE can be associated with expectations of stronger growth or a perception that the business carries relatively low risk, while slower growth or higher uncertainty is usually associated with a lower, more conservative PE.
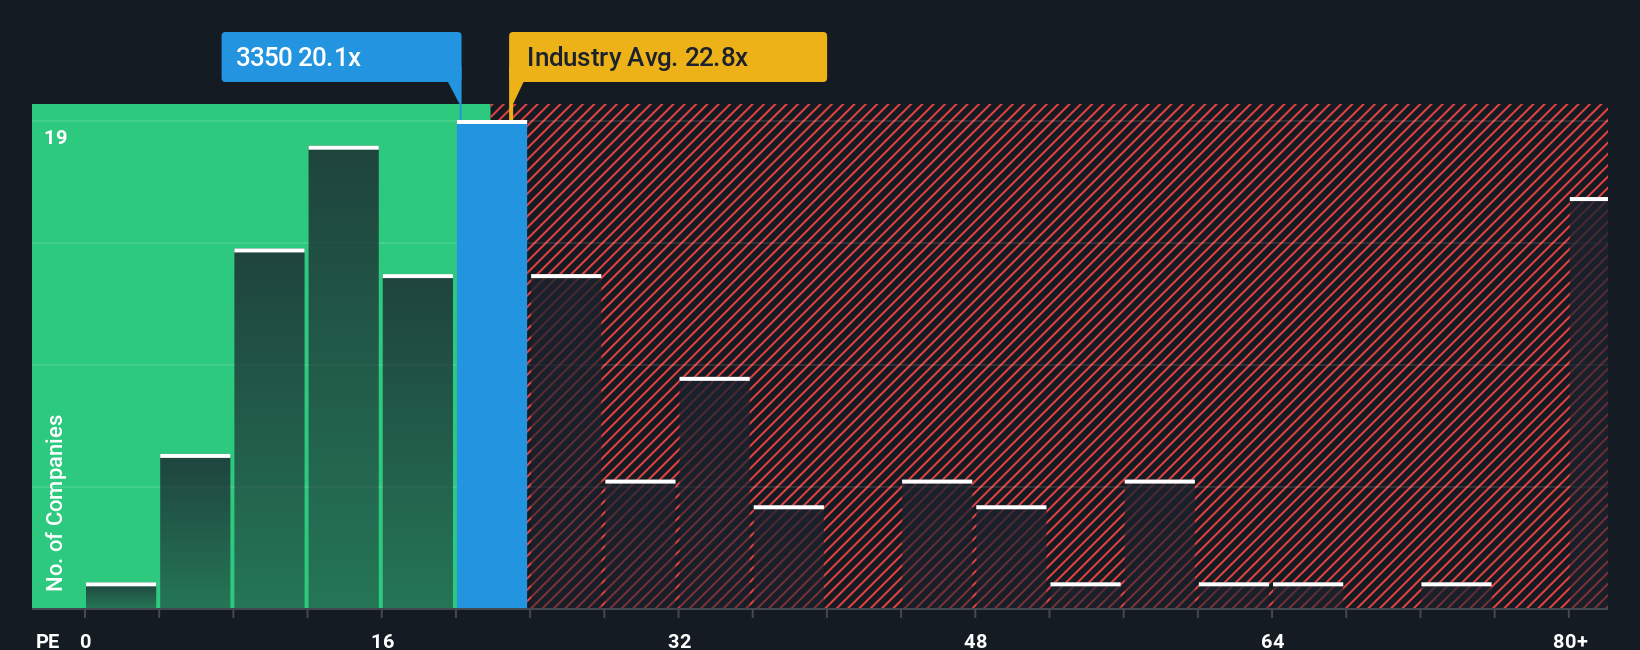
Metaplanet currently trades at about 22.5x earnings, slightly below the Hospitality industry average of roughly 23.6x and above the peer group average of around 18.2x. To move beyond these broad comparisons, Simply Wall St uses a proprietary Fair Ratio, which estimates what a stock’s PE could be after factoring in its earnings growth outlook, profitability, risk profile, size and industry context. This can be more informative than a simple peer or industry check, which may miss how unique a company’s financial profile is.
Metaplanet’s Fair Ratio is about 45.6x, roughly double its current 22.5x PE, which indicates the market is assigning a significant discount relative to what its fundamentals might typically justify.
Result: UNDERVALUED
PE ratios tell one story, but what if the real opportunity lies elsewhere? Discover 1447 companies where insiders are betting big on explosive growth.
Upgrade Your Decision Making: Choose your Metaplanet Narrative
Earlier we mentioned that there is an even better way to understand valuation, so let us introduce you to Narratives, a simple way to connect your view of Metaplanet’s story with the numbers behind its fair value. A Narrative is your own explanation of what you think will drive the company over time, translated into assumptions like future revenue growth, profit margins and the discount rate, which then flow through to a financial forecast and a fair value estimate. On Simply Wall St, millions of investors build and share Narratives on the Community page, making this approach accessible even if you are not a professional analyst. Narratives can support your decision making by clearly showing how your Fair Value compares with the current price, and they update dynamically as new information such as earnings releases or major news arrives. For Metaplanet, one investor might see long term growth potential and assign a higher fair value, while another expects slower expansion and a lower fair value, but both are using Narratives to turn their story into a concrete framework for analysis.
Do you think there's more to the story for Metaplanet? Head over to our Community to see what others are saying!
This article by Simply Wall St is general in nature. We provide commentary based on historical data and analyst forecasts only using an unbiased methodology and our articles are not intended to be financial advice. It does not constitute a recommendation to buy or sell any stock, and does not take account of your objectives, or your financial situation. We aim to bring you long-term focused analysis driven by fundamental data. Note that our analysis may not factor in the latest price-sensitive company announcements or qualitative material. Simply Wall St has no position in any stocks mentioned.
Have feedback on this article? Concerned about the content? Get in touch with us directly. Alternatively, email editorial-team@simplywallst.com