
- LIVE QUOTES
- LEARN
- HELP
 Nasdaq
 Wall Street Journal
EN
Is Starbucks Stock Still Attractive After Union Push and China Expansion Plans in 2025?
- If you are wondering whether Starbucks at around $85 is a bargain or a value trap, you are not alone. This breakdown unpacks that question in detail.
- The stock has bounced about 3.8% over the last week and 0.7% over the last month, but it is still down roughly 7.3% year to date and 4.8% over the last year. This suggests the market is still undecided on its long term direction.
- Recent headlines have focused on Starbucks navigating shifting consumer spending, ongoing unionization efforts in parts of its US store base, and a renewed push into international markets such as China to reignite growth. At the same time, investors are watching how its evolving store footprint and new product initiatives might reshape both margins and the long term growth profile.
- Despite the brand strength, Starbucks currently scores just 0/6 on our valuation checks, suggesting limited signs of undervaluation on traditional metrics. Next, we will walk through several valuation approaches and then circle back to a different way to think about what the market might really be pricing in.
Starbucks scores just 0/6 on our valuation checks. See what other red flags we found in the full valuation breakdown.
Approach 1: Starbucks Discounted Cash Flow (DCF) Analysis
A Discounted Cash Flow, or DCF, model estimates what a business is worth today by projecting its future cash flows and discounting them back into today’s dollars using a required rate of return. For Starbucks, the model used is a 2 stage Free Cash Flow to Equity approach based on cash flow projections.
Starbucks generated around $2.2 billion of free cash flow over the last twelve months, and analysts expect this to rise to roughly $3.6 billion by fiscal 2028. Beyond the explicit analyst horizon, Simply Wall St extrapolates further growth, lifting projected free cash flow to about $4.1 billion by 2035 as the company expands its global footprint and optimizes its store base.
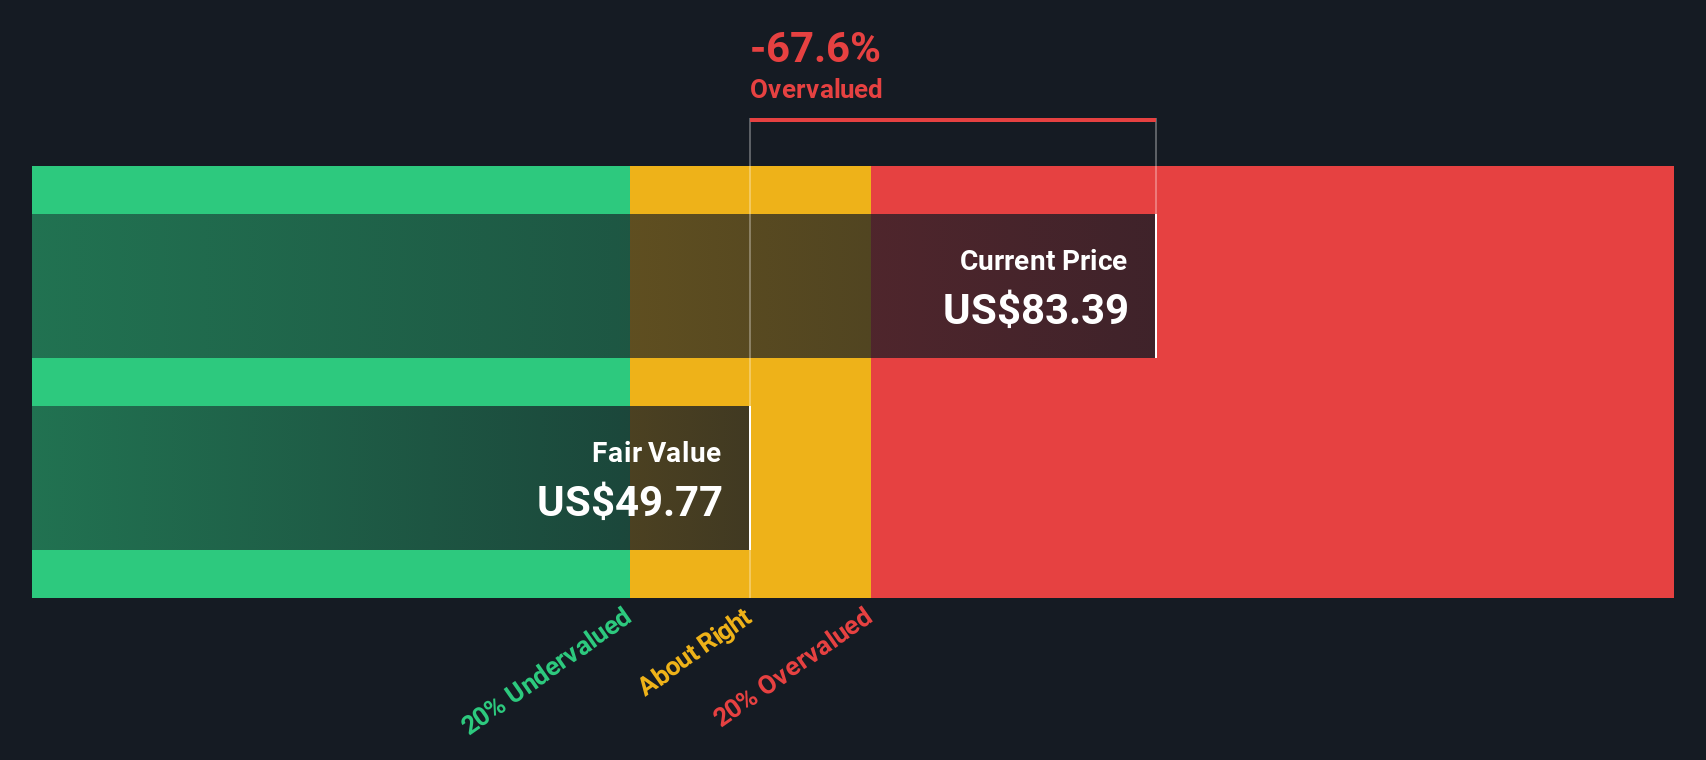
When all these projected cash flows are discounted back into today’s dollars, the DCF model arrives at an intrinsic value of about $48.24 per share. Compared with the current share price around $85, this indicates that Starbucks is approximately 77.0% overvalued based on this cash flow outlook.
Result: OVERVALUED
Our Discounted Cash Flow (DCF) analysis suggests Starbucks may be overvalued by 77.0%. Discover 906 undervalued stocks or create your own screener to find better value opportunities.
Approach 2: Starbucks Price vs Earnings
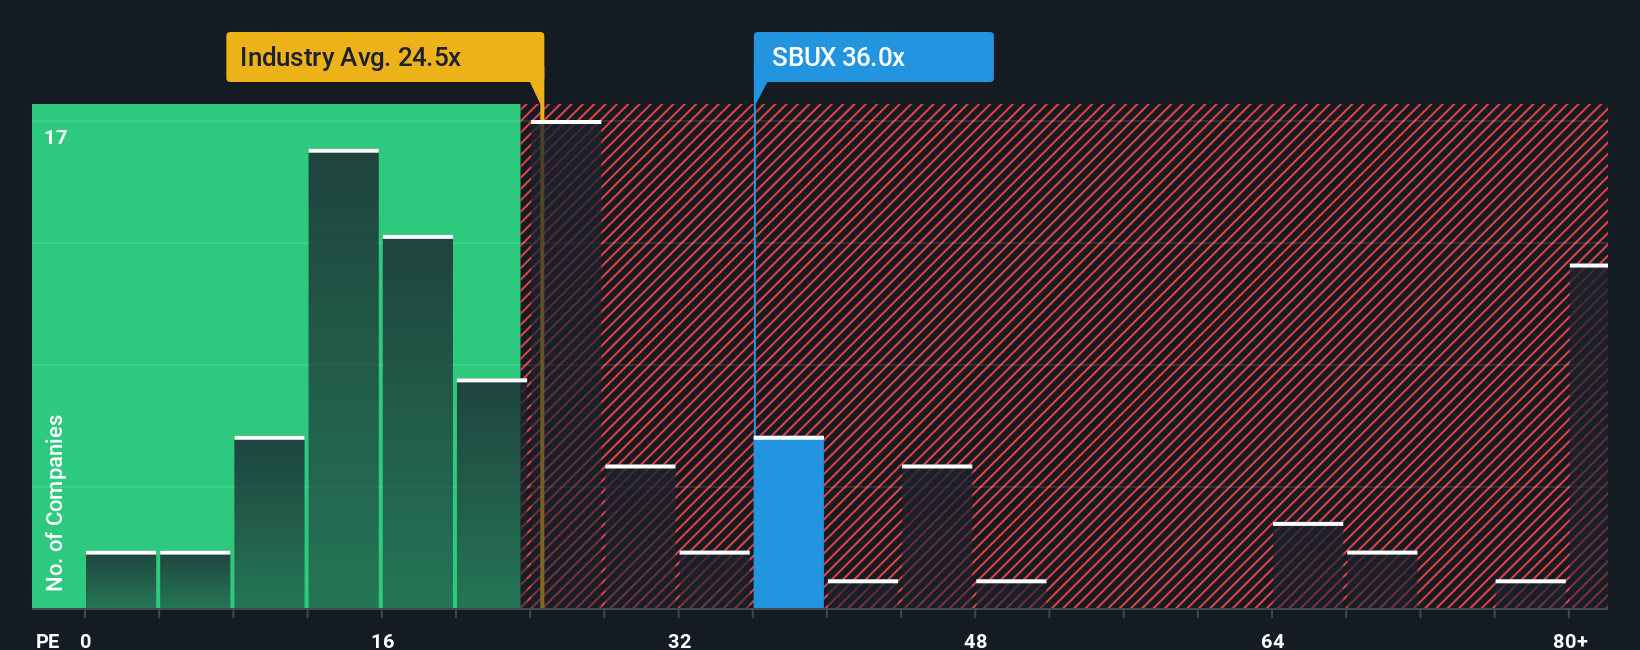
For profitable companies like Starbucks, the price to earnings, or PE, ratio is a useful way to gauge how much investors are willing to pay for each dollar of current earnings. In simple terms, higher expected growth and lower perceived risk usually justify a higher PE multiple, while slower growth or greater uncertainty point to a lower, more conservative range.
Starbucks currently trades on a PE of about 52.3x, which is not only above the broader Hospitality industry average of roughly 23.1x, but also slightly above its peer group average of around 50.2x. To move beyond these blunt comparisons, Simply Wall St uses a proprietary “Fair Ratio”, which estimates what Starbucks PE should be once factors like its earnings growth outlook, profitability, industry, market cap and company specific risks are all taken into account. For Starbucks, that Fair Ratio is 36.8x.
Because this Fair Ratio sits meaningfully below the current multiple of 52.3x, the PE based view suggests the market is paying a premium that looks difficult to justify on fundamentals alone.
Result: OVERVALUED
PE ratios tell one story, but what if the real opportunity lies elsewhere? Discover 1447 companies where insiders are betting big on explosive growth.
Upgrade Your Decision Making, Choose your Starbucks Narrative
Earlier we mentioned that there is an even better way to understand valuation. Let us introduce you to Narratives, a simple framework on Simply Wall St’s Community page that lets you attach a clear story to your numbers by linking your view of a company’s strategy and risks to a specific forecast for revenue, earnings and margins, and then to a Fair Value you can compare with today’s share price to decide whether to buy, hold or sell. All of this updates automatically as new news, earnings and data arrive. For Starbucks for example, one investor might build a cautious Narrative around slowing China growth, persistent labor pressure and mid single digit revenue growth that leads to a Fair Value closer to $73. Another might lean into a successful turnaround, stronger long term demand and higher margins that support a Fair Value near $115. By seeing and stress testing these different Narratives side by side, you can quickly understand what would need to be true for the stock to be cheap or expensive in your own eyes.
Do you think there's more to the story for Starbucks? Head over to our Community to see what others are saying!

This article by Simply Wall St is general in nature. We provide commentary based on historical data and analyst forecasts only using an unbiased methodology and our articles are not intended to be financial advice. It does not constitute a recommendation to buy or sell any stock, and does not take account of your objectives, or your financial situation. We aim to bring you long-term focused analysis driven by fundamental data. Note that our analysis may not factor in the latest price-sensitive company announcements or qualitative material. Simply Wall St has no position in any stocks mentioned.
Have feedback on this article? Concerned about the content? Get in touch with us directly. Alternatively, email editorial-team@simplywallst.com