
- LIVE QUOTES
- LEARN
- HELP
 Nasdaq
 Wall Street Journal
EN
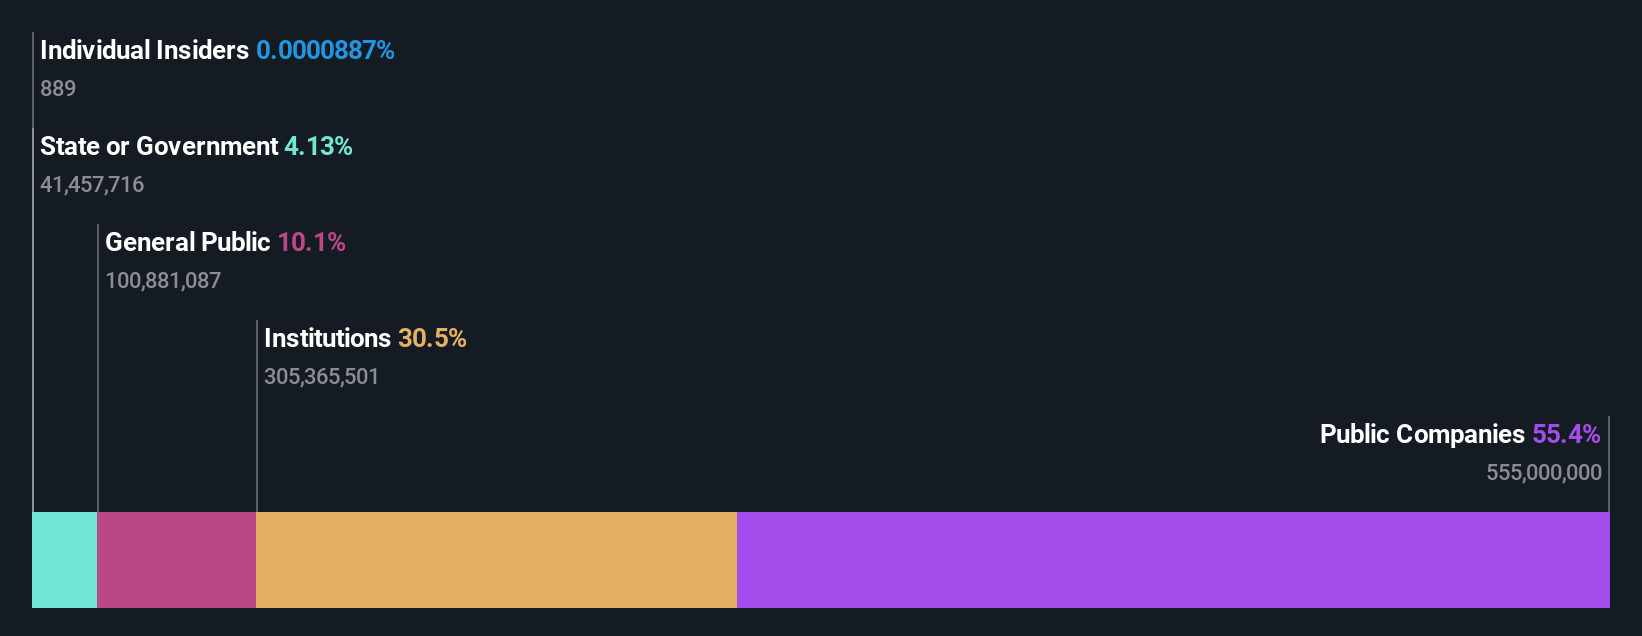
Public companies account for 55% of SBI Life Insurance Company Limited's (NSE:SBILIFE) ownership, while institutions account for 30%
Key Insights
- The considerable ownership by public companies in SBI Life Insurance indicates that they collectively have a greater say in management and business strategy
- The largest shareholder of the company is State Bank of India with a 55% stake
- Institutions own 30% of SBI Life Insurance
A look at the shareholders of SBI Life Insurance Company Limited (NSE:SBILIFE) can tell us which group is most powerful. We can see that public companies own the lion's share in the company with 55% ownership. That is, the group stands to benefit the most if the stock rises (or lose the most if there is a downturn).
And institutions on the other hand have a 30% ownership in the company. Generally speaking, as a company grows, institutions will increase their ownership. Conversely, insiders often decrease their ownership over time.
Let's take a closer look to see what the different types of shareholders can tell us about SBI Life Insurance.
View our latest analysis for SBI Life Insurance
What Does The Institutional Ownership Tell Us About SBI Life Insurance?
Institutions typically measure themselves against a benchmark when reporting to their own investors, so they often become more enthusiastic about a stock once it's included in a major index. We would expect most companies to have some institutions on the register, especially if they are growing.
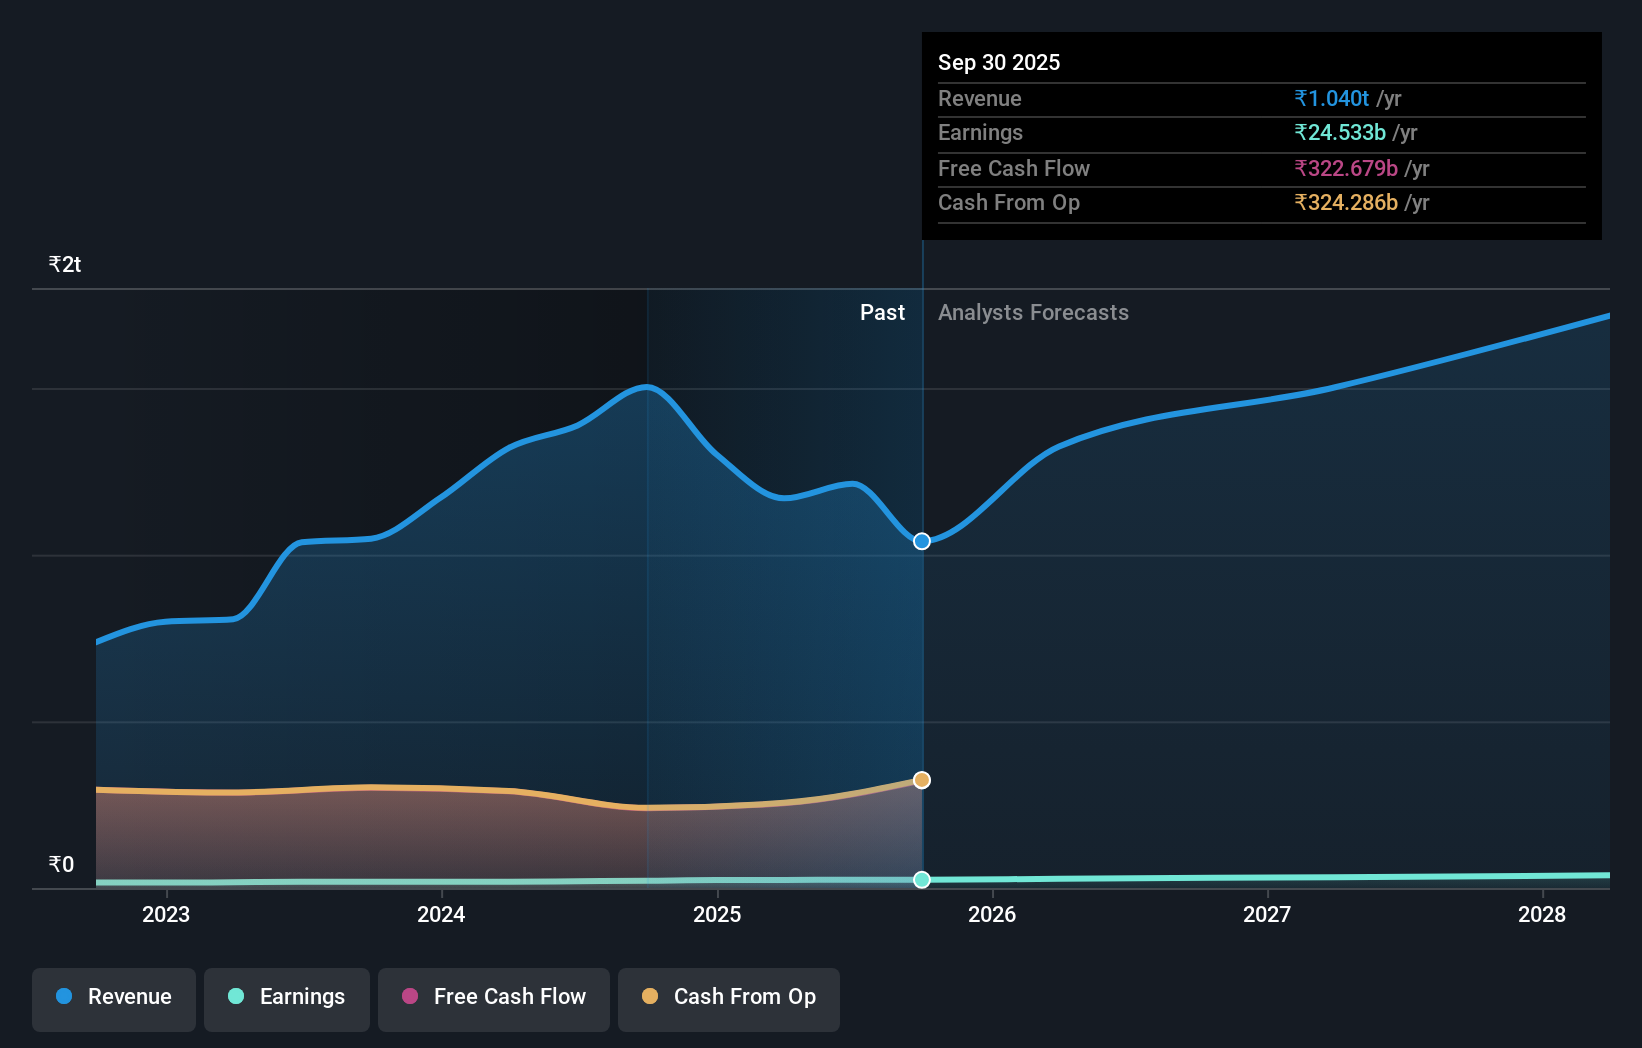
We can see that SBI Life Insurance does have institutional investors; and they hold a good portion of the company's stock. This can indicate that the company has a certain degree of credibility in the investment community. However, it is best to be wary of relying on the supposed validation that comes with institutional investors. They too, get it wrong sometimes. When multiple institutions own a stock, there's always a risk that they are in a 'crowded trade'. When such a trade goes wrong, multiple parties may compete to sell stock fast. This risk is higher in a company without a history of growth. You can see SBI Life Insurance's historic earnings and revenue below, but keep in mind there's always more to the story.
SBI Life Insurance is not owned by hedge funds. State Bank of India is currently the company's largest shareholder with 55% of shares outstanding. With such a huge stake in the ownership, we infer that they have significant control of the future of the company. The second and third largest shareholders are HDFC Asset Management Company Limited and ICICI Prudential Asset Management Company Limited, with an equal amount of shares to their name at 4.1%.
Researching institutional ownership is a good way to gauge and filter a stock's expected performance. The same can be achieved by studying analyst sentiments. Quite a few analysts cover the stock, so you could look into forecast growth quite easily.
Insider Ownership Of SBI Life Insurance
While the precise definition of an insider can be subjective, almost everyone considers board members to be insiders. The company management answer to the board and the latter should represent the interests of shareholders. Notably, sometimes top-level managers are on the board themselves.
Most consider insider ownership a positive because it can indicate the board is well aligned with other shareholders. However, on some occasions too much power is concentrated within this group.
Our most recent data indicates that insiders own less than 1% of SBI Life Insurance Company Limited. As it is a large company, we'd only expect insiders to own a small percentage of it. But it's worth noting that they own ₹1.8m worth of shares. In this sort of situation, it can be more interesting to see if those insiders have been buying or selling.
General Public Ownership
With a 10% ownership, the general public, mostly comprising of individual investors, have some degree of sway over SBI Life Insurance. This size of ownership, while considerable, may not be enough to change company policy if the decision is not in sync with other large shareholders.
Public Company Ownership
Public companies currently own 55% of SBI Life Insurance stock. We can't be certain but it is quite possible this is a strategic stake. The businesses may be similar, or work together.
Next Steps:
While it is well worth considering the different groups that own a company, there are other factors that are even more important.
I always like to check for a history of revenue growth. You can too, by accessing this free chart of historic revenue and earnings in this detailed graph.
If you are like me, you may want to think about whether this company will grow or shrink. Luckily, you can check this free report showing analyst forecasts for its future.
NB: Figures in this article are calculated using data from the last twelve months, which refer to the 12-month period ending on the last date of the month the financial statement is dated. This may not be consistent with full year annual report figures.
Have feedback on this article? Concerned about the content? Get in touch with us directly. Alternatively, email editorial-team (at) simplywallst.com.
This article by Simply Wall St is general in nature. We provide commentary based on historical data and analyst forecasts only using an unbiased methodology and our articles are not intended to be financial advice. It does not constitute a recommendation to buy or sell any stock, and does not take account of your objectives, or your financial situation. We aim to bring you long-term focused analysis driven by fundamental data. Note that our analysis may not factor in the latest price-sensitive company announcements or qualitative material. Simply Wall St has no position in any stocks mentioned.