
- LIVE QUOTES
- LEARN
- HELP
 Nasdaq
 Wall Street Journal
EN
boohoo group (LON:DEBS) Is Finding It Tricky To Allocate Its Capital
When it comes to investing, there are some useful financial metrics that can warn us when a business is potentially in trouble. More often than not, we'll see a declining return on capital employed (ROCE) and a declining amount of capital employed. Basically the company is earning less on its investments and it is also reducing its total assets. Having said that, after a brief look, boohoo group (LON:DEBS) we aren't filled with optimism, but let's investigate further.
Return On Capital Employed (ROCE): What Is It?
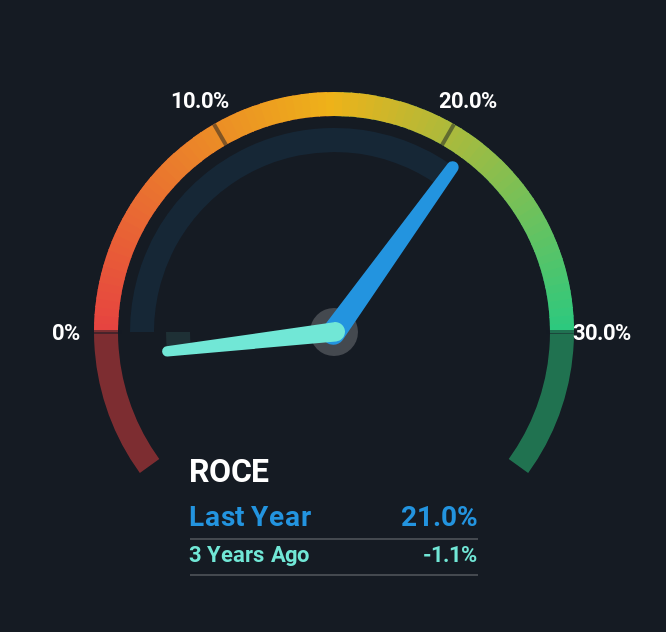
For those who don't know, ROCE is a measure of a company's yearly pre-tax profit (its return), relative to the capital employed in the business. To calculate this metric for boohoo group, this is the formula:
Return on Capital Employed = Earnings Before Interest and Tax (EBIT) ÷ (Total Assets - Current Liabilities)
0.21 = UK£50m ÷ (UK£470m - UK£234m) (Based on the trailing twelve months to August 2025).
Therefore, boohoo group has an ROCE of 21%. In absolute terms that's a great return and it's even better than the Specialty Retail industry average of 13%.
See our latest analysis for boohoo group
In the above chart we have measured boohoo group's prior ROCE against its prior performance, but the future is arguably more important. If you'd like, you can check out the forecasts from the analysts covering boohoo group for free.
So How Is boohoo group's ROCE Trending?
We aren't inspired by the trend, given ROCE has reduced by 22% over the last five years and boohoo group is applying -44% less capital in the business, even after the capital raising they conducted (prior to their latest reported figures).
Another thing to note, boohoo group has a high ratio of current liabilities to total assets of 50%. This can bring about some risks because the company is basically operating with a rather large reliance on its suppliers or other sorts of short-term creditors. While it's not necessarily a bad thing, it can be beneficial if this ratio is lower.
The Key Takeaway
In summary, it's unfortunate that boohoo group is shrinking its capital base and also generating lower returns. Unsurprisingly then, the stock has dived 93% over the last five years, so investors are recognizing these changes and don't like the company's prospects. Unless there is a shift to a more positive trajectory in these metrics, we would look elsewhere.
On a final note, we found 3 warning signs for boohoo group (2 don't sit too well with us) you should be aware of.
If you'd like to see other companies earning high returns, check out our free list of companies earning high returns with solid balance sheets here.
Have feedback on this article? Concerned about the content? Get in touch with us directly. Alternatively, email editorial-team (at) simplywallst.com.
This article by Simply Wall St is general in nature. We provide commentary based on historical data and analyst forecasts only using an unbiased methodology and our articles are not intended to be financial advice. It does not constitute a recommendation to buy or sell any stock, and does not take account of your objectives, or your financial situation. We aim to bring you long-term focused analysis driven by fundamental data. Note that our analysis may not factor in the latest price-sensitive company announcements or qualitative material. Simply Wall St has no position in any stocks mentioned.