
- LIVE QUOTES
- LEARN
- HELP
 Nasdaq
 Wall Street Journal
EN
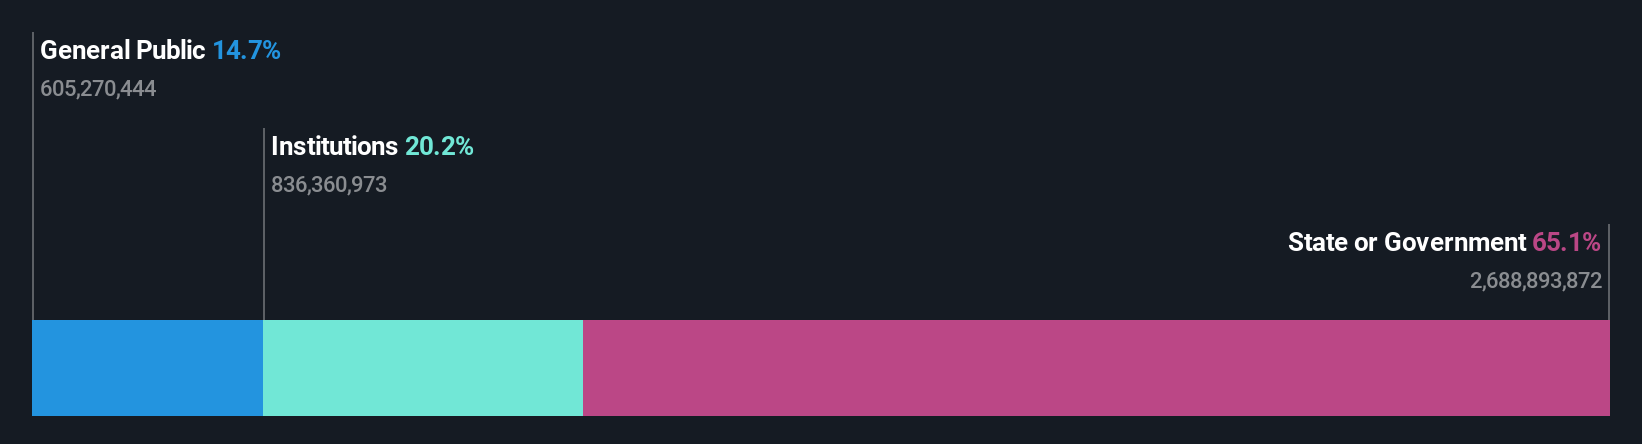
Steel Authority of India Limited's (NSE:SAIL) top owners are state or government with 65% stake, while 20% is held by institutions
Key Insights
- The considerable ownership by state or government in Steel Authority of India indicates that they collectively have a greater say in management and business strategy
- 65% of the company is held by a single shareholder (India)
- Institutional ownership in Steel Authority of India is 20%
A look at the shareholders of Steel Authority of India Limited (NSE:SAIL) can tell us which group is most powerful. We can see that state or government own the lion's share in the company with 65% ownership. In other words, the group stands to gain the most (or lose the most) from their investment into the company.
Institutions, on the other hand, account for 20% of the company's stockholders. Institutions will often hold stock in bigger companies, and we expect to see insiders owning a noticeable percentage of the smaller ones.
Let's take a closer look to see what the different types of shareholders can tell us about Steel Authority of India.
See our latest analysis for Steel Authority of India
What Does The Institutional Ownership Tell Us About Steel Authority of India?
Many institutions measure their performance against an index that approximates the local market. So they usually pay more attention to companies that are included in major indices.
We can see that Steel Authority of India does have institutional investors; and they hold a good portion of the company's stock. This implies the analysts working for those institutions have looked at the stock and they like it. But just like anyone else, they could be wrong. When multiple institutions own a stock, there's always a risk that they are in a 'crowded trade'. When such a trade goes wrong, multiple parties may compete to sell stock fast. This risk is higher in a company without a history of growth. You can see Steel Authority of India's historic earnings and revenue below, but keep in mind there's always more to the story.

We note that hedge funds don't have a meaningful investment in Steel Authority of India. Looking at our data, we can see that the largest shareholder is India with 65% of shares outstanding. With such a huge stake in the ownership, we infer that they have significant control of the future of the company. For context, the second largest shareholder holds about 10.0% of the shares outstanding, followed by an ownership of 1.7% by the third-largest shareholder.
While it makes sense to study institutional ownership data for a company, it also makes sense to study analyst sentiments to know which way the wind is blowing. Quite a few analysts cover the stock, so you could look into forecast growth quite easily.
Insider Ownership Of Steel Authority of India
While the precise definition of an insider can be subjective, almost everyone considers board members to be insiders. Company management run the business, but the CEO will answer to the board, even if he or she is a member of it.
I generally consider insider ownership to be a good thing. However, on some occasions it makes it more difficult for other shareholders to hold the board accountable for decisions.
We note our data does not show any board members holding shares, personally. It is unusual not to have at least some personal holdings by board members, so our data might be flawed. A good next step would be to check how much the CEO is paid.
General Public Ownership
The general public, who are usually individual investors, hold a 15% stake in Steel Authority of India. This size of ownership, while considerable, may not be enough to change company policy if the decision is not in sync with other large shareholders.
Next Steps:
I find it very interesting to look at who exactly owns a company. But to truly gain insight, we need to consider other information, too. For example, we've discovered 2 warning signs for Steel Authority of India (1 doesn't sit too well with us!) that you should be aware of before investing here.
If you are like me, you may want to think about whether this company will grow or shrink. Luckily, you can check this free report showing analyst forecasts for its future.
NB: Figures in this article are calculated using data from the last twelve months, which refer to the 12-month period ending on the last date of the month the financial statement is dated. This may not be consistent with full year annual report figures.
Have feedback on this article? Concerned about the content? Get in touch with us directly. Alternatively, email editorial-team (at) simplywallst.com.
This article by Simply Wall St is general in nature. We provide commentary based on historical data and analyst forecasts only using an unbiased methodology and our articles are not intended to be financial advice. It does not constitute a recommendation to buy or sell any stock, and does not take account of your objectives, or your financial situation. We aim to bring you long-term focused analysis driven by fundamental data. Note that our analysis may not factor in the latest price-sensitive company announcements or qualitative material. Simply Wall St has no position in any stocks mentioned.