
- LIVE QUOTES
- LEARN
- HELP
 Nasdaq
 Wall Street Journal
EN
Can Ascendis Pharma Still Offer Value After 2025 Rally and Endocrinology Milestones?
- If you are wondering whether Ascendis Pharma at around $220 a share is still good value after such a strong run, you are not alone. That is exactly what this breakdown is going to tackle.
- The stock has climbed 7.3% over the last week, 7.8% over the past month, and is up 59.7% year to date and 69.7% over the last year, signaling that market expectations and risk perceptions have shifted meaningfully.
- Recent headlines have focused on Ascendis progress in advancing and de-risking its endocrinology rare disease portfolio, including regulatory and clinical milestones that have helped reinforce the long-term revenue story. At the same time, investors have been reacting to updates around its broader pipeline and financing moves, which together help explain why the share price has been resilient even in a choppy biotech tape.
- Right now, Ascendis scores a 3/6 valuation check score, meaning it screens as undervalued on half of the metrics tracked, which is solid but not flawless. Next, this breakdown will unpack what that 3 out of 6 really means across different valuation approaches, and then circle back at the end to a more holistic way of thinking about what the stock may be worth.
Approach 1: Ascendis Pharma Discounted Cash Flow (DCF) Analysis
A Discounted Cash Flow model takes the cash Ascendis Pharma is expected to generate in the future and discounts those amounts back into today’s euros to estimate what the business is worth now.
On a trailing basis, Ascendis is still burning cash, with last twelve month free cash flow of about €114 million in the red. However, analyst forecasts and subsequent extrapolations point to a steep improvement, with free cash flow expected to reach roughly €1.23 billion by 2029 and continue rising through 2035 as the endocrinology rare disease portfolio and broader pipeline scale up.
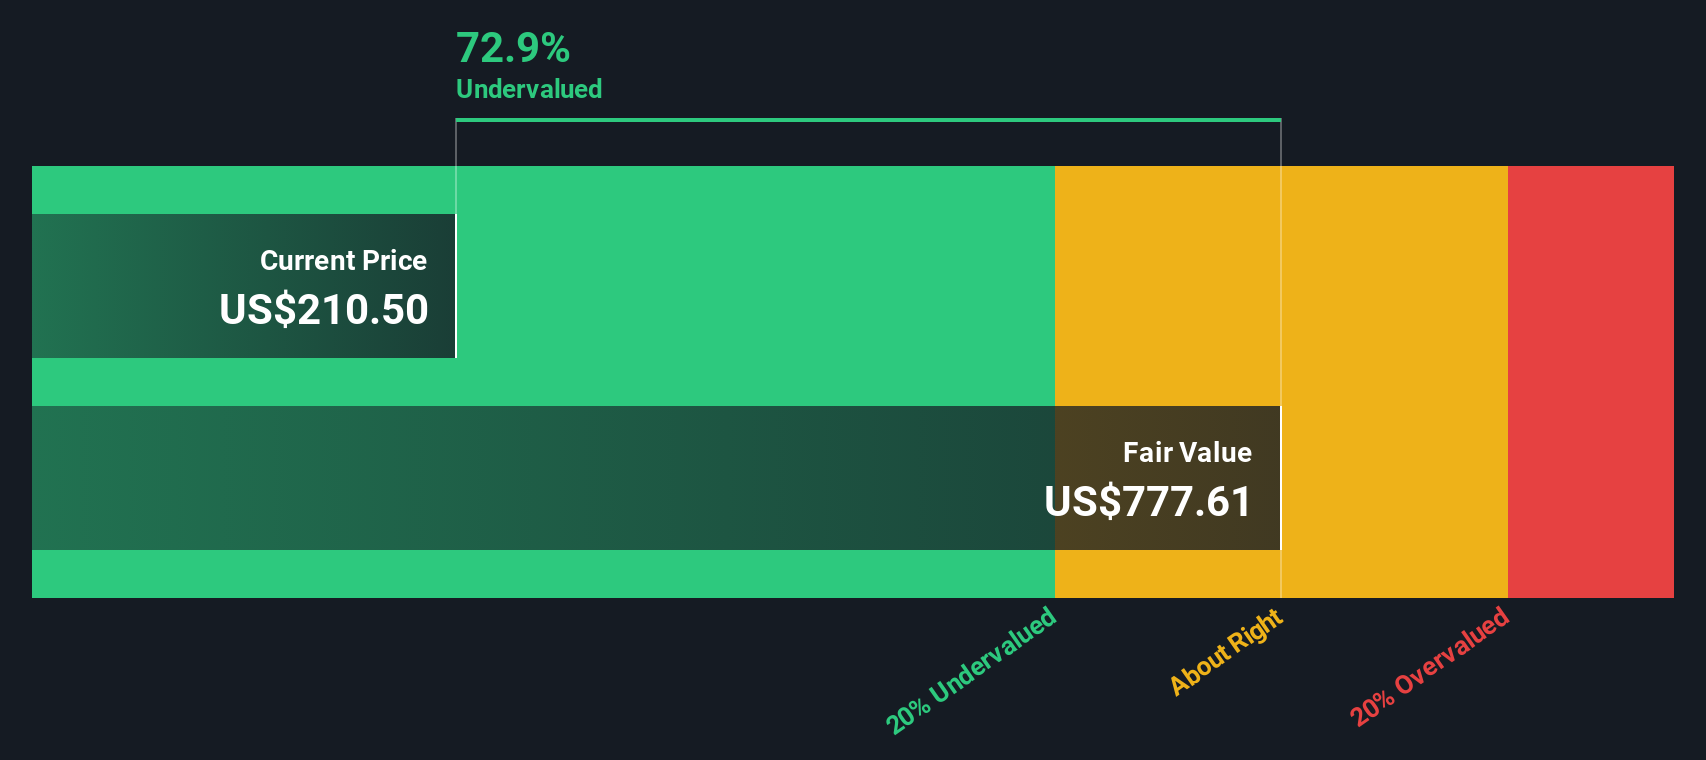
Using a two-stage Free Cash Flow to Equity model built on those projections, Simply Wall St estimates an intrinsic value of about $746 per share, compared with a current market price near $220. That implies the stock trades at roughly a 70.4% discount to its DCF-based fair value, even after the strong recent rally.
Result: UNDERVALUED
Our Discounted Cash Flow (DCF) analysis suggests Ascendis Pharma is undervalued by 70.4%. Track this in your watchlist or portfolio, or discover 908 more undervalued stocks based on cash flows.
Approach 2: Ascendis Pharma Price vs Sales
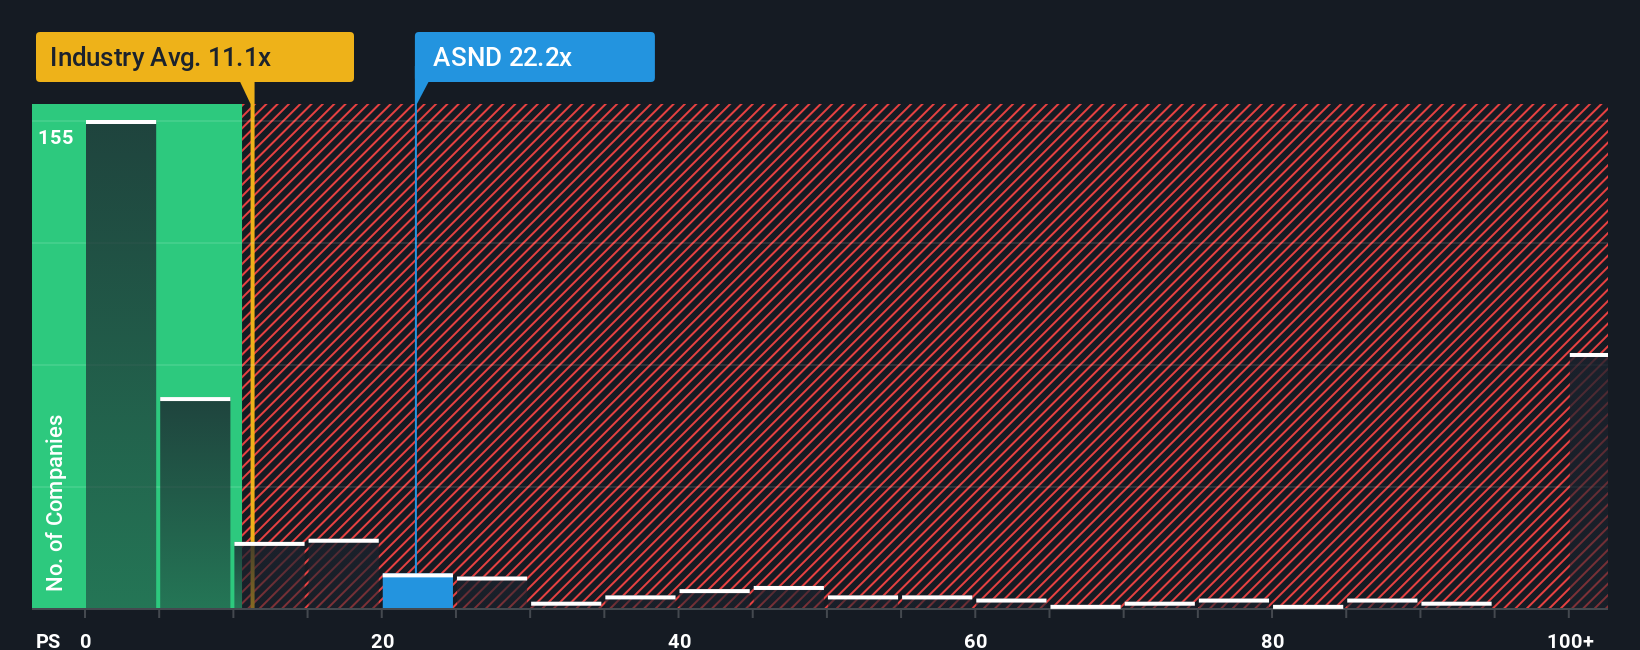
For high growth biotechs that are not yet consistently profitable, the Price to Sales, or P S, ratio is often the cleanest way to compare valuation, because it focuses on what the market is paying for each dollar of current revenue rather than volatile or negative earnings.
In general, faster and more reliable growth, higher margins, and lower perceived risk justify a higher “normal” multiple. Slower growth, weaker profitability, or elevated risk usually pull that fair range down. For Ascendis, the current P S ratio sits around 17.7x, above the broader Biotechs industry average of about 12.1x but below the roughly 31.1x seen across its closest high growth peers.
Simply Wall St also uses a proprietary “Fair Ratio” framework, which estimates what P S multiple a stock should trade on, given its growth outlook, profitability profile, industry, market cap, and risk factors. This tends to be more informative than a simple peer or industry comparison, because it adjusts for company specific strengths and weaknesses. For Ascendis, the Fair Ratio is 16.6x, a touch below the current 17.7x multiple, suggesting the stock is trading modestly ahead of what those fundamentals alone would justify.
Result: OVERVALUED
PS ratios tell one story, but what if the real opportunity lies elsewhere? Discover 1444 companies where insiders are betting big on explosive growth.
Upgrade Your Decision Making: Choose your Ascendis Pharma Narrative
Earlier we mentioned that there is an even better way to understand valuation, so let us introduce you to Narratives, a simple framework that lets you attach a clear story, your view on a companys products, risks, and market, to the numbers, your assumptions for future revenue, earnings, margins, and fair value.
A Narrative on Simply Wall St connects three pieces together: the business story you believe, the financial forecast that flows from that story, and a resulting fair value that you can then compare to todays share price to decide whether Ascendis looks like a buy, hold, or sell.
These Narratives live in the Community page on Simply Wall St, where millions of investors can explore and create them. They automatically update when new information arrives, like earnings results, major trial updates, or regulatory news. This helps your fair value view stay in sync with the latest data without you having to rebuild everything from scratch.
For example, a more optimistic Ascendis Narrative might focus on rapid global uptake of YORVIPATH and SKYTROFA, potential for TransCon CNP, and robust margins that support a higher fair value per share. A more cautious Narrative could assume slower adoption, greater pricing pressure, and execution risks that imply a lower fair value range. By comparing these story driven outcomes to the current price, you can decide which version of the future you find more credible and then choose how to proceed.
Do you think there's more to the story for Ascendis Pharma? Head over to our Community to see what others are saying!

This article by Simply Wall St is general in nature. We provide commentary based on historical data and analyst forecasts only using an unbiased methodology and our articles are not intended to be financial advice. It does not constitute a recommendation to buy or sell any stock, and does not take account of your objectives, or your financial situation. We aim to bring you long-term focused analysis driven by fundamental data. Note that our analysis may not factor in the latest price-sensitive company announcements or qualitative material. Simply Wall St has no position in any stocks mentioned.
Have feedback on this article? Concerned about the content? Get in touch with us directly. Alternatively, email editorial-team@simplywallst.com