
- LIVE QUOTES
- LEARN
- HELP
 Nasdaq
 Wall Street Journal
EN
Institutional investors control 58% of Marubeni Corporation (TSE:8002) and were rewarded last week after stock increased 7.9%
Key Insights
- Given the large stake in the stock by institutions, Marubeni's stock price might be vulnerable to their trading decisions
- 50% of the business is held by the top 16 shareholders
- Analyst forecasts along with ownership data serve to give a strong idea about prospects for a business
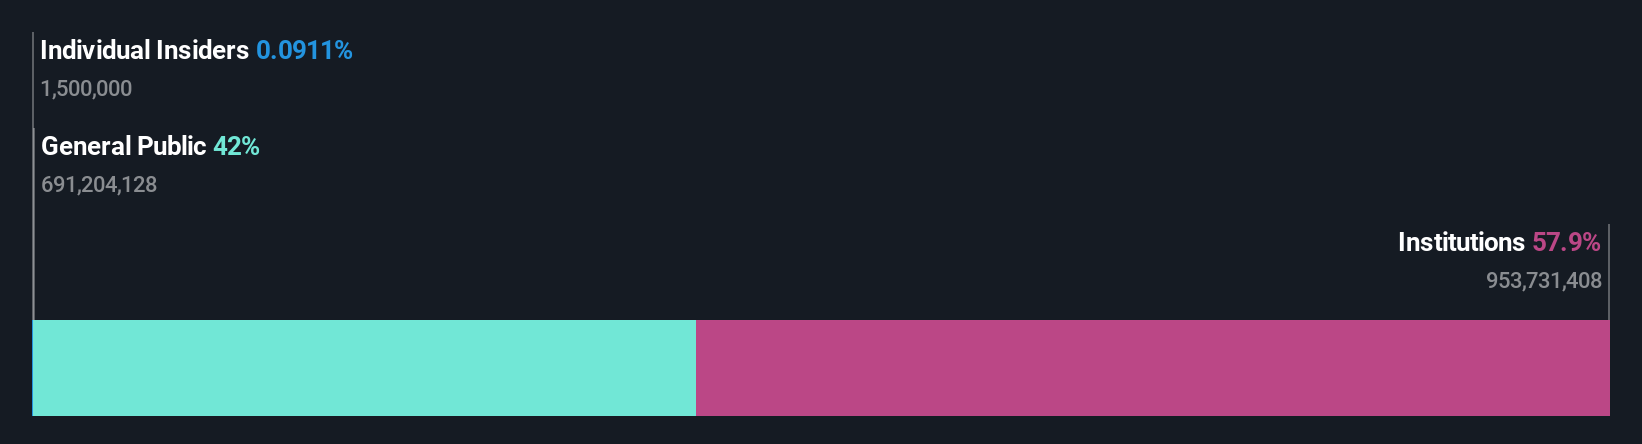
If you want to know who really controls Marubeni Corporation (TSE:8002), then you'll have to look at the makeup of its share registry. And the group that holds the biggest piece of the pie are institutions with 58% ownership. That is, the group stands to benefit the most if the stock rises (or lose the most if there is a downturn).
And as as result, institutional investors reaped the most rewards after the company's stock price gained 7.9% last week. One-year return to shareholders is currently 107% and last week’s gain was the icing on the cake.
In the chart below, we zoom in on the different ownership groups of Marubeni.
See our latest analysis for Marubeni
What Does The Institutional Ownership Tell Us About Marubeni?
Institutions typically measure themselves against a benchmark when reporting to their own investors, so they often become more enthusiastic about a stock once it's included in a major index. We would expect most companies to have some institutions on the register, especially if they are growing.
We can see that Marubeni does have institutional investors; and they hold a good portion of the company's stock. This suggests some credibility amongst professional investors. But we can't rely on that fact alone since institutions make bad investments sometimes, just like everyone does. When multiple institutions own a stock, there's always a risk that they are in a 'crowded trade'. When such a trade goes wrong, multiple parties may compete to sell stock fast. This risk is higher in a company without a history of growth. You can see Marubeni's historic earnings and revenue below, but keep in mind there's always more to the story.

Institutional investors own over 50% of the company, so together than can probably strongly influence board decisions. We note that hedge funds don't have a meaningful investment in Marubeni. New England Asset Management, Inc. is currently the largest shareholder, with 9.4% of shares outstanding. BlackRock, Inc. is the second largest shareholder owning 6.7% of common stock, and Nomura Asset Management Co., Ltd. holds about 5.1% of the company stock.
Looking at the shareholder registry, we can see that 50% of the ownership is controlled by the top 16 shareholders, meaning that no single shareholder has a majority interest in the ownership.
While it makes sense to study institutional ownership data for a company, it also makes sense to study analyst sentiments to know which way the wind is blowing. There are plenty of analysts covering the stock, so it might be worth seeing what they are forecasting, too.
Insider Ownership Of Marubeni
While the precise definition of an insider can be subjective, almost everyone considers board members to be insiders. Management ultimately answers to the board. However, it is not uncommon for managers to be executive board members, especially if they are a founder or the CEO.
Insider ownership is positive when it signals leadership are thinking like the true owners of the company. However, high insider ownership can also give immense power to a small group within the company. This can be negative in some circumstances.
Our information suggests that Marubeni Corporation insiders own under 1% of the company. As it is a large company, we'd only expect insiders to own a small percentage of it. But it's worth noting that they own JP¥6.9b worth of shares. Arguably recent buying and selling is just as important to consider. You can click here to see if insiders have been buying or selling.
General Public Ownership
The general public, who are usually individual investors, hold a 42% stake in Marubeni. This size of ownership, while considerable, may not be enough to change company policy if the decision is not in sync with other large shareholders.
Next Steps:
It's always worth thinking about the different groups who own shares in a company. But to understand Marubeni better, we need to consider many other factors. Be aware that Marubeni is showing 2 warning signs in our investment analysis , and 1 of those is concerning...
If you would prefer discover what analysts are predicting in terms of future growth, do not miss this free report on analyst forecasts.
NB: Figures in this article are calculated using data from the last twelve months, which refer to the 12-month period ending on the last date of the month the financial statement is dated. This may not be consistent with full year annual report figures.
Have feedback on this article? Concerned about the content? Get in touch with us directly. Alternatively, email editorial-team (at) simplywallst.com.
This article by Simply Wall St is general in nature. We provide commentary based on historical data and analyst forecasts only using an unbiased methodology and our articles are not intended to be financial advice. It does not constitute a recommendation to buy or sell any stock, and does not take account of your objectives, or your financial situation. We aim to bring you long-term focused analysis driven by fundamental data. Note that our analysis may not factor in the latest price-sensitive company announcements or qualitative material. Simply Wall St has no position in any stocks mentioned.