
- LIVE QUOTES
- LEARN
- HELP
 Nasdaq
 Wall Street Journal
EN
Is It Time To Reassess Hewlett Packard Enterprise After Its Strong Multi Year Share Price Run?
- If you are wondering whether Hewlett Packard Enterprise is still a smart buy at around $23.87, you are not alone. This stock has quietly become a favorite talking point for value focused investors.
- HPE has put together a solid run, with the share price up 2.3% over the last week, 4.6% over the last month and 11.2% year to date, adding to a much stronger 12.3% 1 year gain and an impressive 126.9% over 5 years.
- Recent headlines have highlighted HPE's push deeper into hybrid cloud and edge computing, as well as strategic partnerships that aim to monetize AI and data centric workloads more effectively. These moves help explain why the market has been slowly repricing the stock, as investors reassess both its growth runway and risk profile.
- On our valuation framework, Hewlett Packard Enterprise scores a 5/6 on undervaluation checks, and you can see the breakdown in this valuation score. Next we will walk through the main valuation approaches behind that number and then finish with a more holistic way of thinking about what HPE might really be worth.
Approach 1: Hewlett Packard Enterprise Discounted Cash Flow (DCF) Analysis
A Discounted Cash Flow model projects Hewlett Packard Enterprise future cash flows and then discounts them back into today’s dollars, aiming to estimate what the whole business is worth right now.
HPE is currently generating trailing free cash flow of about $174 million, but analyst forecasts and internal estimates see this ramping up materially over time. By 2030, HPE free cash flow is projected to reach roughly $3.9 billion, with a detailed 2 stage Free Cash Flow to Equity model used to bridge the years in between, including analyst inputs for the medium term and extrapolated growth thereafter.
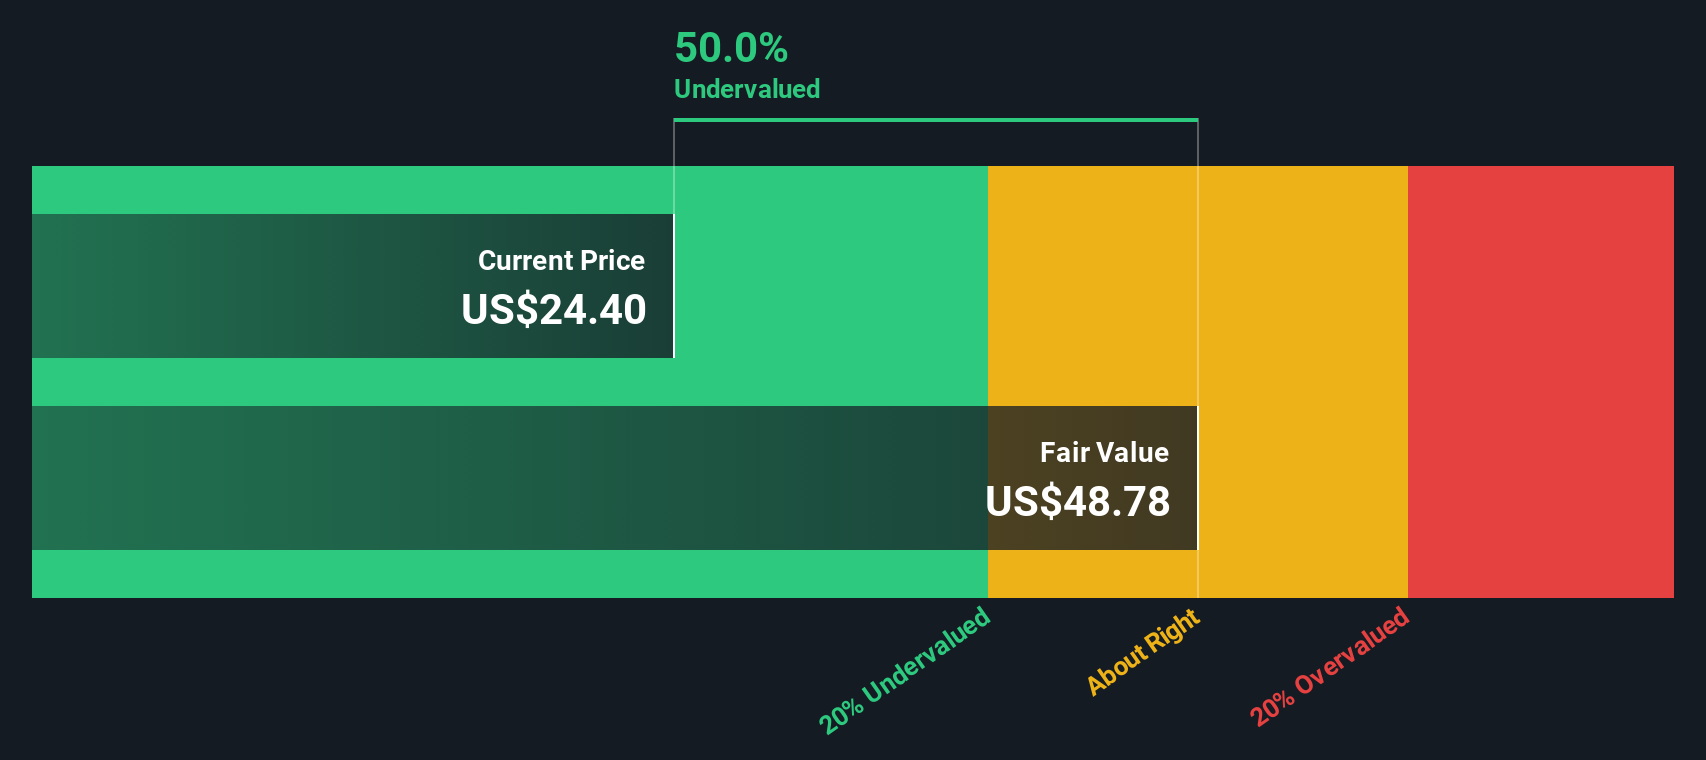
Rolling all of those projected cash flows together and discounting them to the present gives an intrinsic value of about $36.26 per share. Compared with the current share price around $23.87, the DCF implies the stock is trading at roughly a 34.2% discount.
Result: UNDERVALUED
Our Discounted Cash Flow (DCF) analysis suggests Hewlett Packard Enterprise is undervalued by 34.2%. Track this in your watchlist or portfolio, or discover 908 more undervalued stocks based on cash flows.
Approach 2: Hewlett Packard Enterprise Price vs Sales
For companies like Hewlett Packard Enterprise that are steadily monetizing large revenue streams, the price to sales ratio is a practical way to gauge how much investors are paying for each dollar of revenue. In general, higher expected growth and lower perceived risk justify a richer multiple, while slower growth or bumpier cash flows argue for a lower, more conservative range.
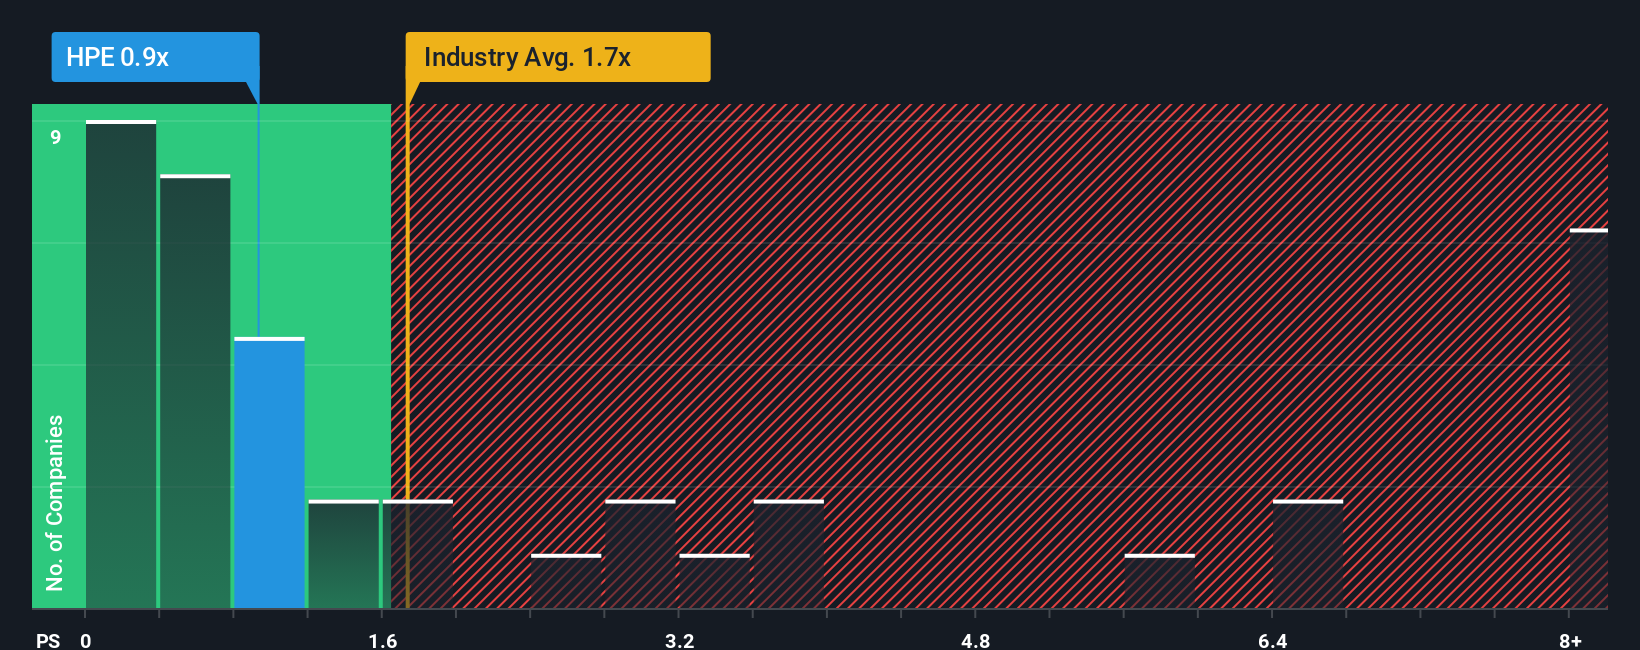
HPE currently trades on a price to sales multiple of about 0.92x, which is below both the broader Tech industry average of roughly 1.72x and a peer group average closer to 3.63x. Those comparisons suggest the market is valuing HPE less generously than many of its competitors. Simply Wall St goes a step further by estimating a Fair Ratio of 2.56x for HPE, which reflects what the price to sales multiple would be once you factor in its growth outlook, profitability, risk profile, industry dynamics and market capitalization.
This Fair Ratio is more tailored than a simple peer or industry comparison, because it adjusts for what actually makes HPE unique rather than assuming all tech stocks deserve the same treatment. With the current 0.92x multiple sitting well below the 2.56x Fair Ratio, the model used in this analysis indicates the shares still look attractively priced on a sales basis.
Result: UNDERVALUED
PS ratios tell one story, but what if the real opportunity lies elsewhere? Discover 1445 companies where insiders are betting big on explosive growth.
Upgrade Your Decision Making: Choose your Hewlett Packard Enterprise Narrative
Earlier we mentioned that there is an even better way to understand valuation, so let us introduce you to Narratives, a simple way to connect your view of Hewlett Packard Enterprise’s strategy and risks to specific forecasts for revenue, earnings and margins, and then to a Fair Value you can easily compare with today’s share price on Simply Wall St’s Community page. On this page, millions of investors share their own Narratives that automatically update as new news or earnings arrive. A bullish investor might build a Narrative where HPE’s AI networking and cloud momentum are assumed to drive earnings toward the upper end of current expectations and justify a Fair Value closer to $30. A more cautious investor might instead focus on integration, debt and margin risks and land nearer $19. Both stories are translated into dynamic Fair Values that show at a glance whether, for their assumptions, the stock looks like a buy, hold, or sell at the current market price.
Do you think there's more to the story for Hewlett Packard Enterprise? Head over to our Community to see what others are saying!

This article by Simply Wall St is general in nature. We provide commentary based on historical data and analyst forecasts only using an unbiased methodology and our articles are not intended to be financial advice. It does not constitute a recommendation to buy or sell any stock, and does not take account of your objectives, or your financial situation. We aim to bring you long-term focused analysis driven by fundamental data. Note that our analysis may not factor in the latest price-sensitive company announcements or qualitative material. Simply Wall St has no position in any stocks mentioned.
Have feedback on this article? Concerned about the content? Get in touch with us directly. Alternatively, email editorial-team@simplywallst.com