
- LIVE QUOTES
- LEARN
- HELP
 Nasdaq
 Wall Street Journal
EN
Is Celsius Still Attractive After Its 2025 Surge and New Retail Partnerships?
- If you are wondering whether Celsius Holdings is still a smart consideration after its huge run up, or if the fizz has finally come out of the can, this breakdown will walk you through what the current price really implies.
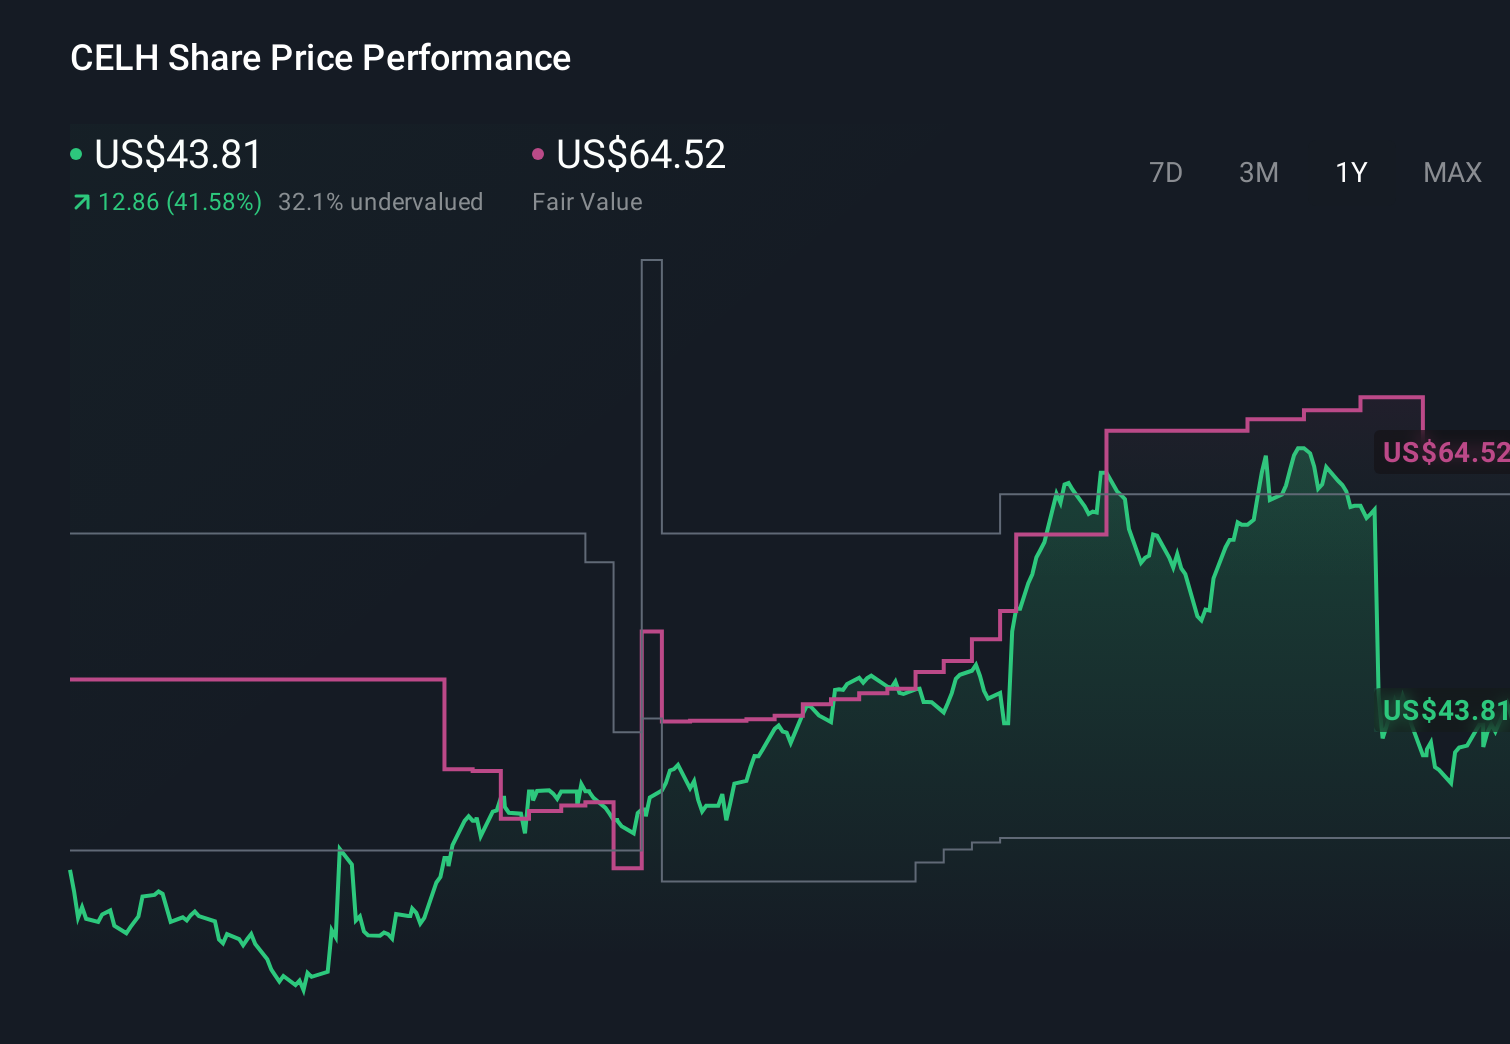
- Over the last year the stock is up 37.9%, including a 61.2% gain year to date and a recent 4.2% jump over the past week. This indicates that the market is still reassessing its growth story and risk profile.
- Recent headlines have focused on Celsius expanding distribution through major retail channels and deepening partnerships in the energy drink space, reinforcing its positioning as a fast growing challenger brand. At the same time, analysts and investors have been debating whether that growth justifies the premium price tag that has built up over the past few years, especially as competition intensifies.
- Right now Celsius scores just 2/6 on our valuation checks. We will unpack what different valuation methods say about the stock and, by the end of the article, look at a more nuanced way to judge whether the current price really makes sense.
Celsius Holdings scores just 2/6 on our valuation checks. See what other red flags we found in the full valuation breakdown.
Approach 1: Celsius Holdings Discounted Cash Flow (DCF) Analysis
A Discounted Cash Flow model estimates what a business is worth today by projecting the cash it could generate in the future and then discounting those cash flows back to their value in today’s dollars.
For Celsius Holdings, the model starts with last twelve months Free Cash Flow of about $522 million and then layers on analyst forecasts and longer term assumptions. Analyst estimates take FCF to around $653 million by 2029, with further projections beyond that point extrapolated by Simply Wall St using a 2 Stage Free Cash Flow to Equity approach. This reflects strong expected growth, but also slowing expansion as the company matures.
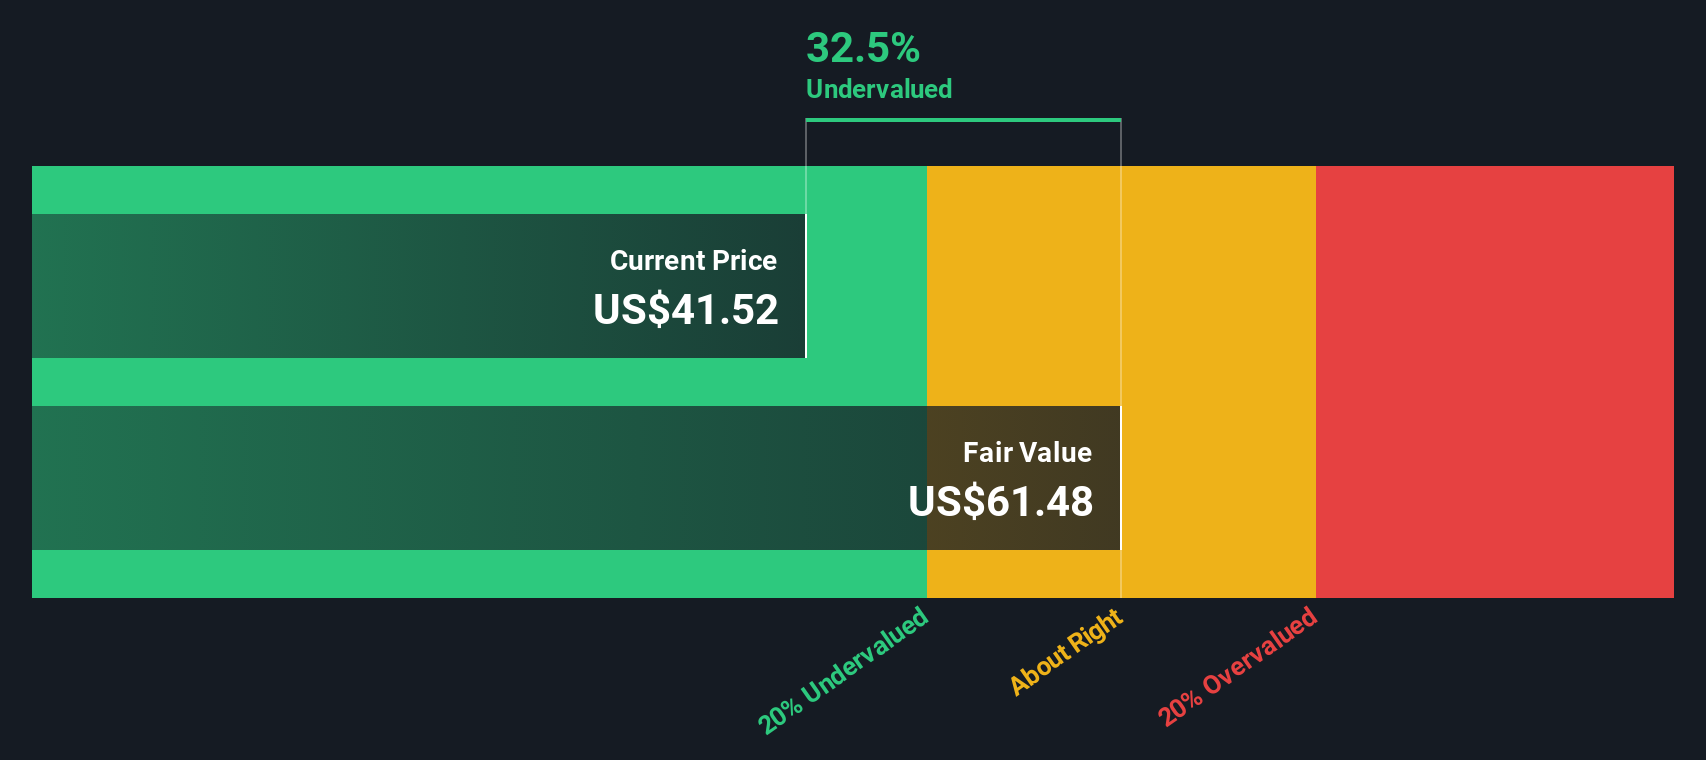
Bringing all those projected cash flows back to today, the DCF model arrives at an intrinsic value of roughly $68.86 per share. Compared with the current market price, this implies the stock is trading at about a 36.3% discount. This suggests investors are not fully pricing in the cash flow potential implied by these forecasts.
Result: UNDERVALUED
Our Discounted Cash Flow (DCF) analysis suggests Celsius Holdings is undervalued by 36.3%. Track this in your watchlist or portfolio, or discover 908 more undervalued stocks based on cash flows.
Approach 2: Celsius Holdings Price vs Sales
For companies that are generating meaningful revenue but are still reinvesting heavily for growth, the price to sales ratio is often a better yardstick than earnings based metrics. It avoids the noise created by short term swings in margins and accounting items, and instead focuses on how much investors are paying for each dollar of revenue today.
That said, what counts as a fair price to sales multiple still depends on growth expectations and risk. Faster growth and durable competitive advantages usually justify a higher multiple, while more cyclical or risky businesses deserve lower ones. Celsius currently trades on a price to sales ratio of about 5.32x, which is well above the Beverage industry average of roughly 2.57x and also higher than the peer average of around 2.31x. Simply Wall St’s Fair Ratio for Celsius, at about 3.70x, is a proprietary estimate of what multiple could be reasonable given its growth outlook, profitability, industry, size and risk profile. Because it explicitly blends these fundamentals, the Fair Ratio is a more tailored benchmark than a simple peer or industry comparison. With the actual multiple sitting notably above 3.70x, the stock appears expensive on a sales basis.
Result: OVERVALUED

PS ratios tell one story, but what if the real opportunity lies elsewhere? Discover 1445 companies where insiders are betting big on explosive growth.
Upgrade Your Decision Making: Choose your Celsius Holdings Narrative
Earlier we mentioned that there is an even better way to understand valuation, so let us introduce you to Narratives, a simple framework on Simply Wall St’s Community page where you connect your view of a company’s story to concrete forecasts for its future revenue, earnings, and margins, and then to a fair value you can compare against today’s share price to decide whether to buy, hold, or sell.
Instead of staring at isolated ratios, you spell out your perspective on Celsius Holdings. For example, one investor might believe distribution partnerships and category growth can support a fair value near $80. A more cautious investor, focused on margin pressure and execution risks, may only see value around $33.50. Because these Narratives live on the platform used by millions of investors, they are automatically updated as new earnings, news, or guidance arrive, keeping your story, numbers, and fair value aligned in real time.
Do you think there's more to the story for Celsius Holdings? Head over to our Community to see what others are saying!
This article by Simply Wall St is general in nature. We provide commentary based on historical data and analyst forecasts only using an unbiased methodology and our articles are not intended to be financial advice. It does not constitute a recommendation to buy or sell any stock, and does not take account of your objectives, or your financial situation. We aim to bring you long-term focused analysis driven by fundamental data. Note that our analysis may not factor in the latest price-sensitive company announcements or qualitative material. Simply Wall St has no position in any stocks mentioned.
Have feedback on this article? Concerned about the content? Get in touch with us directly. Alternatively, email editorial-team@simplywallst.com