
- LIVE QUOTES
- LEARN
- HELP
 Nasdaq
 Wall Street Journal
EN
Is ANI Pharmaceuticals Still Attractively Priced After Its Strong Multi Year Share Price Run?
- Wondering if ANI Pharmaceuticals is still good value after its big run, or if you might be late to the party? You are in the right place to break down what the current price really implies.
- The stock has cooled slightly in the short term, with the share price down 1.7% over the last week and 4.3% over the past month. It is still up 45.0% year to date and 42.1% over the last year, and a huge 111.2% and 157.9% over the past 3 and 5 years respectively.
- Recent attention around ANI Pharmaceuticals has centered on its expanding specialty generics and rare disease portfolio, along with ongoing product launches that have helped underpin its longer term share price strength. Investors are also watching how management executes on its pipeline strategy and capital allocation, which together set expectations for whether this momentum can continue.
- On our framework, ANI Pharmaceuticals scores a 3/6 valuation check, suggesting the market may be partially pricing in its prospects but not fully. Next, we will walk through the main valuation approaches behind that score, and then finish with a more holistic way to think about what the stock is truly worth.
Approach 1: ANI Pharmaceuticals Discounted Cash Flow (DCF) Analysis
A Discounted Cash Flow model estimates what a company is worth today by projecting the cash it can generate in the future and discounting those cash flows back to the present. For ANI Pharmaceuticals, the model used is a 2 Stage Free Cash Flow to Equity approach, based on cash flow projections in $.
The company generated around $138.4 Million in free cash flow over the last twelve months, and analysts expect this to rise to about $218 Million by 2027, with further increases extrapolated out over the following years. Simply Wall St extends these forecasts to 2035, with projected free cash flow rising steadily as the business scales its portfolio and margins.
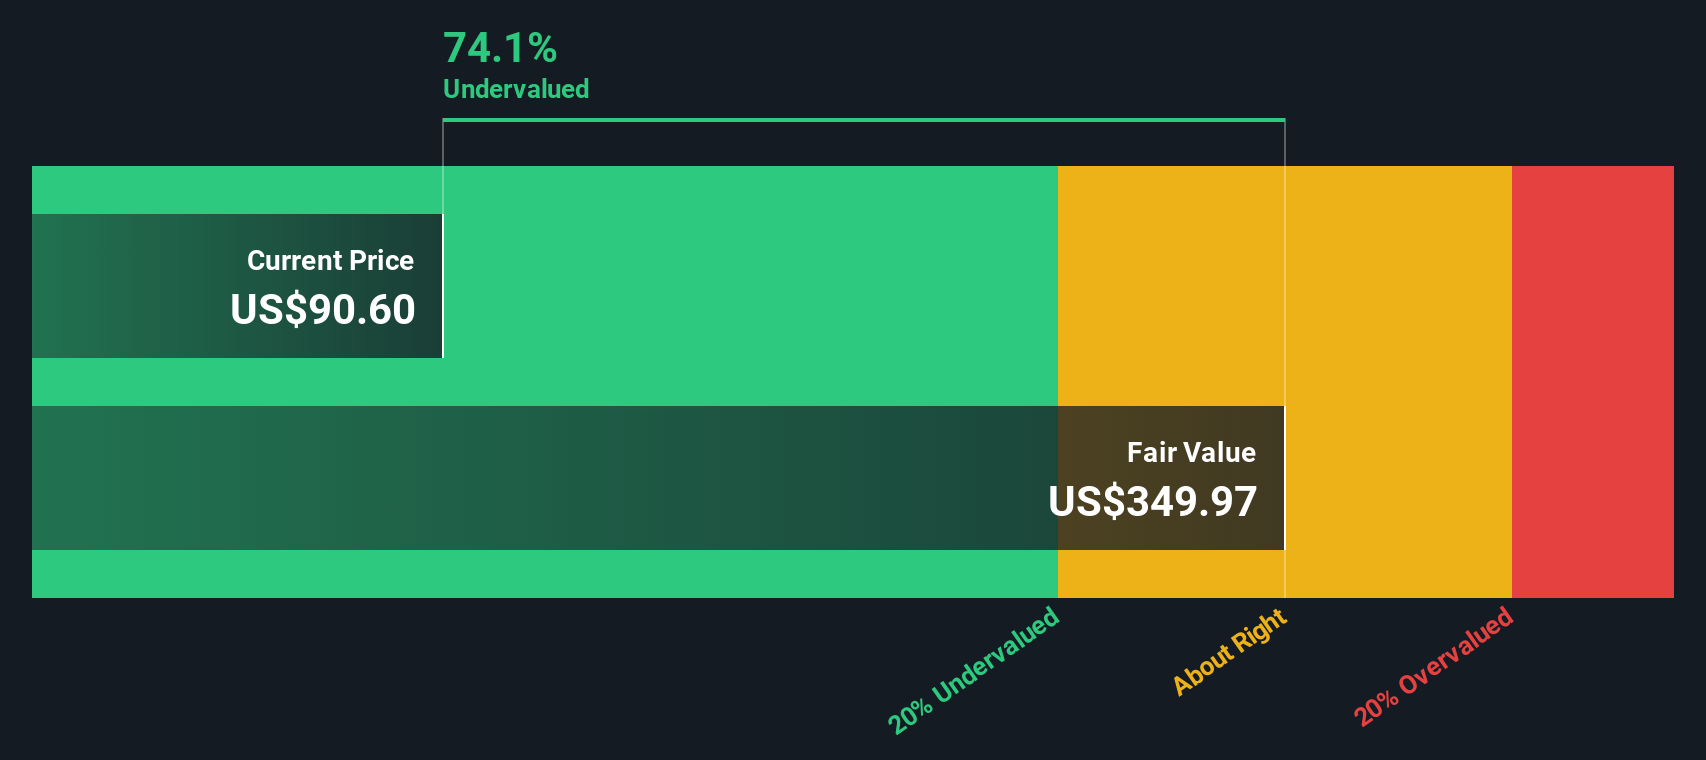
Adding up all these discounted cash flows produces an estimated intrinsic value of around $369.24 per share. Compared with the current share price, this analysis suggests the stock is trading at about a 78.2% discount, indicating that the market appears more cautious than the cash flow outlook.
Result: UNDERVALUED
Our Discounted Cash Flow (DCF) analysis suggests ANI Pharmaceuticals is undervalued by 78.2%. Track this in your watchlist or portfolio, or discover 908 more undervalued stocks based on cash flows.
Approach 2: ANI Pharmaceuticals Price vs Earnings
For profitable companies like ANI Pharmaceuticals, the Price to Earnings (PE) ratio is a practical way to gauge value because it links what investors pay today to the profits the business is actually generating. The “right” PE depends on how quickly earnings are expected to grow and how risky those earnings are, with higher growth and lower perceived risk generally justifying a higher multiple.
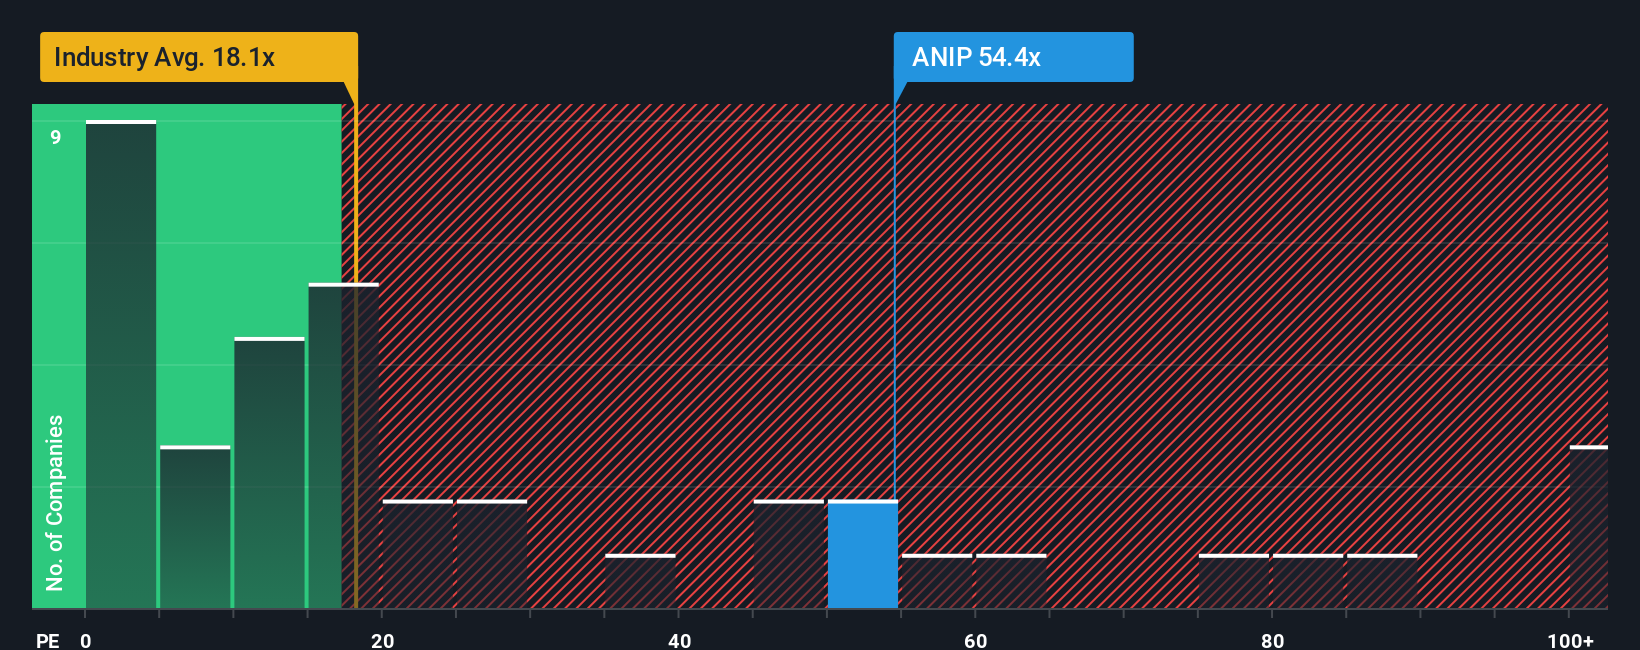
ANI currently trades on a PE of about 49.2x, well above the broader Pharmaceuticals industry average of roughly 19.7x and the peer group average of around 18.7x. That headline premium suggests the market is already baking in strong growth and relatively resilient earnings.
Simply Wall St’s Fair Ratio for ANI is 20.7x, a proprietary estimate of what PE would be reasonable given its earnings growth outlook, profit margins, industry positioning, market cap and risk profile. This is more informative than a simple peer or industry comparison because it tailors the “normal” multiple to ANI’s specific fundamentals rather than assuming all pharma names deserve the same valuation. Since ANI’s current 49.2x PE sits well above the 20.7x Fair Ratio, the stock looks expensive on an earnings multiple basis.
Result: OVERVALUED
PE ratios tell one story, but what if the real opportunity lies elsewhere? Discover 1445 companies where insiders are betting big on explosive growth.
Upgrade Your Decision Making: Choose your ANI Pharmaceuticals Narrative
Earlier we mentioned that there is an even better way to understand valuation, so let us introduce you to Narratives, a simple way to connect your view of a company’s story with a concrete financial forecast and a clear fair value. A Narrative on Simply Wall St is your personal, numbers backed storyline about a business, where you spell out what you think will happen to its revenue, earnings and margins, and the platform automatically turns that into a forecast and a fair value estimate. Narratives live inside the Community page, where millions of investors publish and refine their views, and they are continuously updated when fresh information comes in, like quarterly earnings, new guidance or major news. This makes Narratives a practical decision tool, because you can see at a glance whether your Fair Value still sits above the current price, which may suggest a potential buy, or has fallen below it, which may point toward a hold or sell. For ANI Pharmaceuticals, one Narrative might assume strong Cortrophin Gel expansion and justify a fair value near $120, while a more cautious Narrative that focuses on potential exclusivity loss and margin pressure might land closer to $77.
Do you think there's more to the story for ANI Pharmaceuticals? Head over to our Community to see what others are saying!

This article by Simply Wall St is general in nature. We provide commentary based on historical data and analyst forecasts only using an unbiased methodology and our articles are not intended to be financial advice. It does not constitute a recommendation to buy or sell any stock, and does not take account of your objectives, or your financial situation. We aim to bring you long-term focused analysis driven by fundamental data. Note that our analysis may not factor in the latest price-sensitive company announcements or qualitative material. Simply Wall St has no position in any stocks mentioned.
Have feedback on this article? Concerned about the content? Get in touch with us directly. Alternatively, email editorial-team@simplywallst.com