
- LIVE QUOTES
- LEARN
- HELP
 Nasdaq
 Wall Street Journal
EN
Assessing Johnson & Johnson’s Valuation After a 47% Surge and Strong Cash Flow Outlook
- If you are wondering whether Johnson & Johnson is still a buy after its big run, you are not alone. This article is going to focus squarely on what the current share price really implies about value.
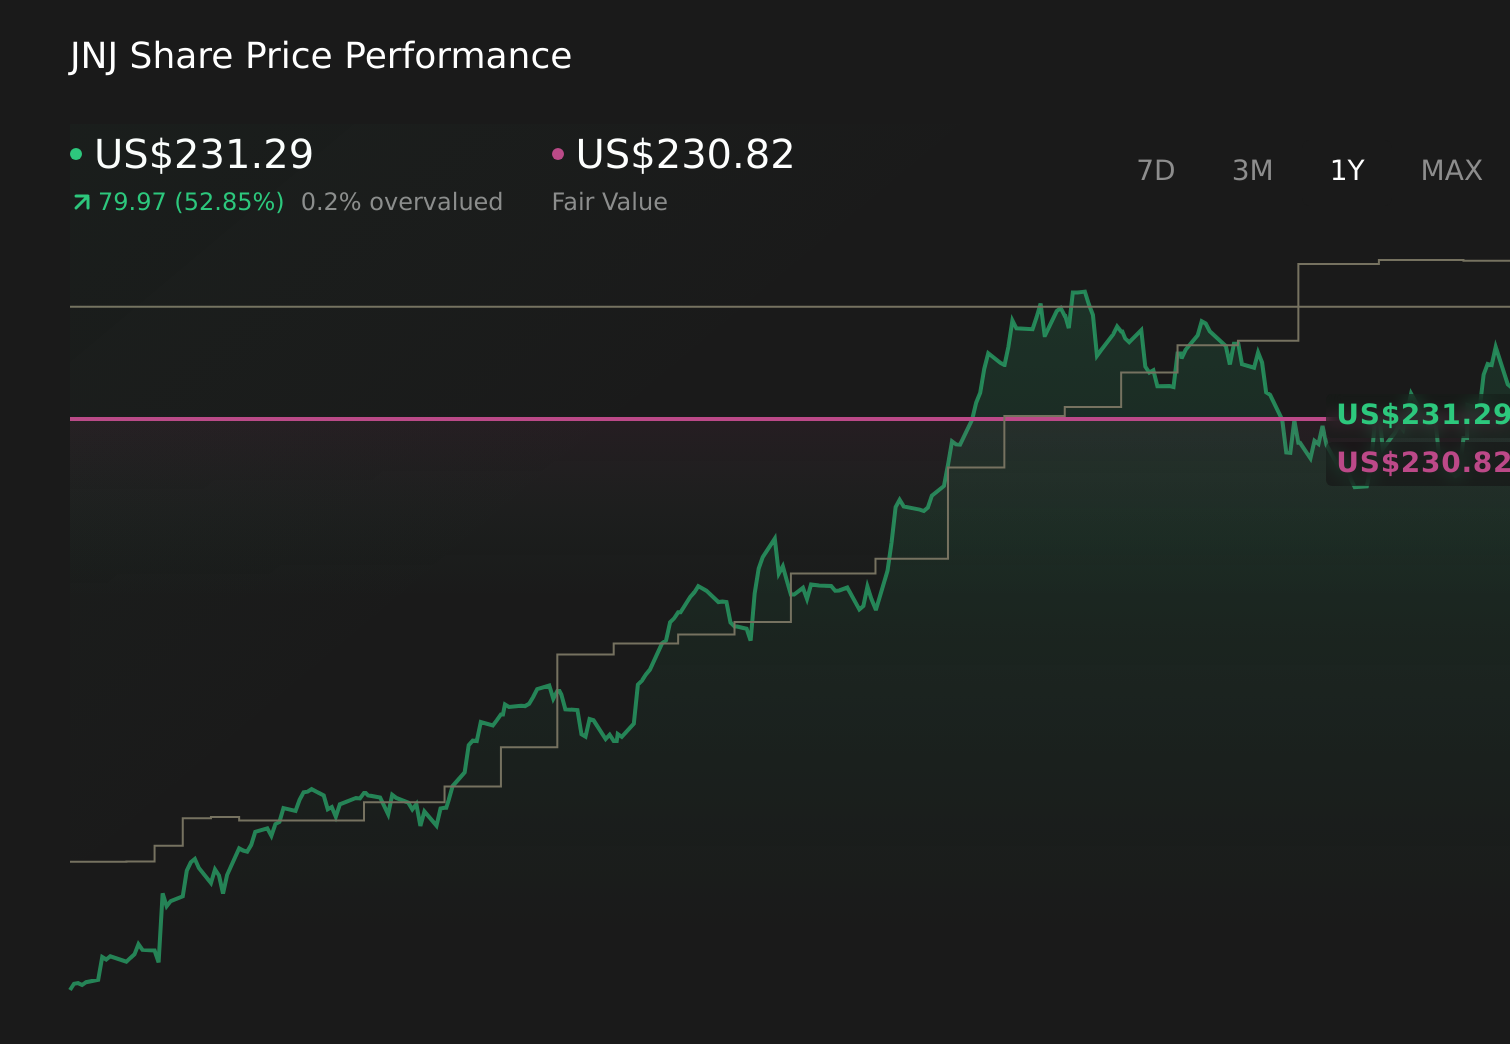
- The stock has climbed to around $211.58, rising 4.8% over the last week, 8.0% over the past month, and 46.9% year to date, with a 48.7% gain over the last year.
- These gains have come as investors have refocused on Johnson & Johnson's core pharmaceuticals and medtech franchises and its long standing reputation as a defensive blue chip. Alongside that, sentiment has been shaped by ongoing developments in its product pipeline and legal overhangs, which together help explain why the market has been willing to re rate the stock.
- Right now, Johnson & Johnson scores a 4/6 valuation check score, suggesting it looks undervalued on several key metrics. Next we will unpack what that means through different valuation lenses, before circling back to an even more powerful way to think about what the market might be missing.
Approach 1: Johnson & Johnson Discounted Cash Flow (DCF) Analysis
A Discounted Cash Flow model estimates what a company is worth by projecting the cash it can generate in the future and then discounting those cash flows back to today in dollar terms. In this case, a 2 Stage Free Cash Flow to Equity model is used.
Johnson & Johnson currently generates last twelve month free cash flow of about $19.5 billion. Analyst forecasts and Simply Wall St extrapolations see this rising steadily, with projected free cash flow reaching roughly $48.0 billion by 2035. The path to that point includes analyst backed estimates through 2029 and then gradually moderating growth assumptions thereafter, reflecting the company’s mature but still expanding pharmaceuticals and medtech businesses.
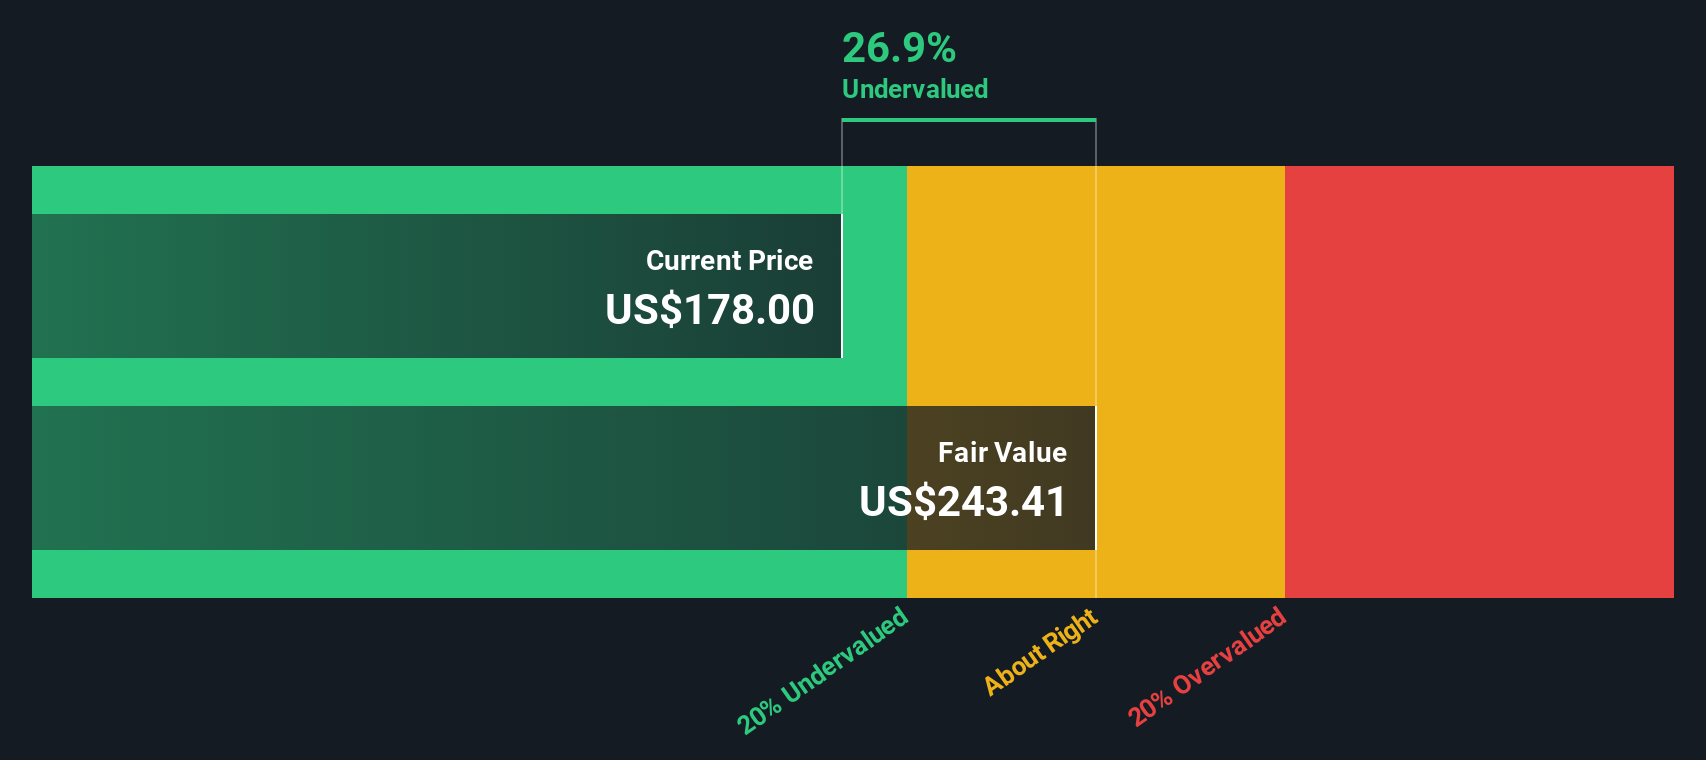
When all of those future cash flows are discounted back to today, the model arrives at an intrinsic value of about $384.15 per share. Compared with the recent share price around $211.58, the DCF suggests the stock is trading at roughly a 44.9% discount, which indicates that the model output is higher than the current share price if these cash flow projections occur as modeled.
Result: UNDERVALUED
Our Discounted Cash Flow (DCF) analysis suggests Johnson & Johnson is undervalued by 44.9%. Track this in your watchlist or portfolio, or discover 908 more undervalued stocks based on cash flows.
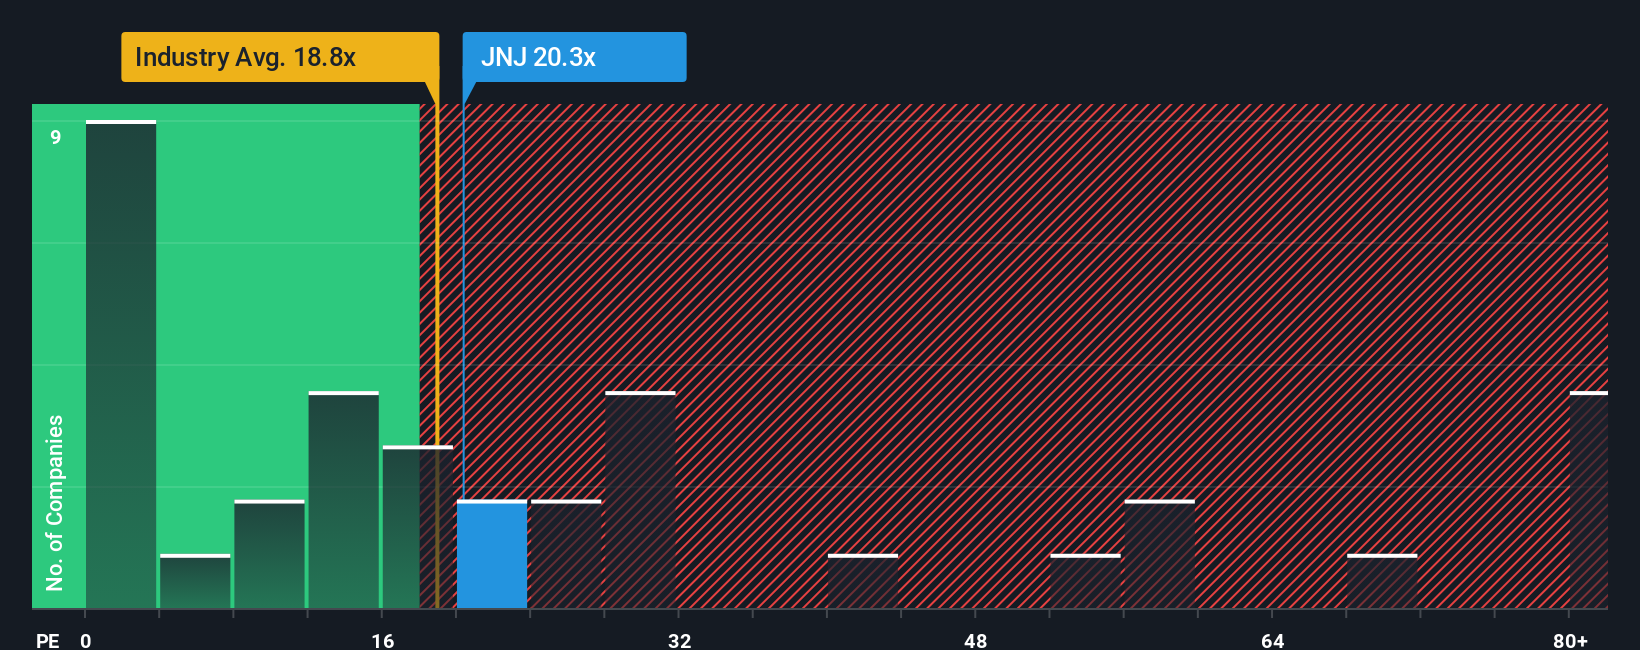
Approach 2: Johnson & Johnson Price vs Earnings
For a mature and consistently profitable business like Johnson & Johnson, the price to earnings ratio is a natural way to gauge value because it links what investors pay directly to the company’s current earning power. In general, companies with stronger growth prospects and lower perceived risk deserve higher PE multiples, while slower growing or riskier firms typically trade on lower ones.
Johnson & Johnson currently trades on a PE of about 20.3x, which is just above the broader Pharmaceuticals industry average of roughly 19.7x but below the peer group average near 23.9x. Simply Wall St goes a step further by estimating a Fair Ratio of around 29.8x, a proprietary view of what the multiple should be after accounting for the company’s earnings growth outlook, margins, industry positioning, market cap and risk profile. This Fair Ratio is more informative than a simple comparison with peers or the sector because it adjusts for Johnson & Johnson’s specific fundamentals rather than assuming all pharma companies deserve similar valuations.
Comparing the current 20.3x PE to the 29.8x Fair Ratio suggests that, on an earnings basis, Johnson & Johnson still trades at a meaningful discount.
Result: UNDERVALUED
PE ratios tell one story, but what if the real opportunity lies elsewhere? Discover 1445 companies where insiders are betting big on explosive growth.
Upgrade Your Decision Making: Choose your Johnson & Johnson Narrative
Earlier we mentioned that there is an even better way to understand valuation, so let us introduce you to Narratives, a simple framework on Simply Wall St’s Community page where you connect your view of Johnson & Johnson’s story to explicit assumptions for future revenue, earnings and margins. These then flow into a forecast and a fair value that is automatically compared with today’s price to help you decide whether to buy or sell. The model is kept dynamically up to date as new news or earnings are released. For example, one investor might build a more optimistic Johnson & Johnson Narrative with stronger pipeline execution and higher margins that supports a fair value above $200.54 per share, while another might construct a more cautious Narrative around litigation and loss of exclusivity risks that points closer to $155.00, both using the same easy tool but different perspectives to reach their own decision.
Do you think there's more to the story for Johnson & Johnson? Head over to our Community to see what others are saying!
This article by Simply Wall St is general in nature. We provide commentary based on historical data and analyst forecasts only using an unbiased methodology and our articles are not intended to be financial advice. It does not constitute a recommendation to buy or sell any stock, and does not take account of your objectives, or your financial situation. We aim to bring you long-term focused analysis driven by fundamental data. Note that our analysis may not factor in the latest price-sensitive company announcements or qualitative material. Simply Wall St has no position in any stocks mentioned.
Have feedback on this article? Concerned about the content? Get in touch with us directly. Alternatively, email editorial-team@simplywallst.com