
- LIVE QUOTES
- LEARN
- HELP
 Nasdaq
 Wall Street Journal
EN
Has Fastenal’s Strong 2025 Share Price Run Left Limited Upside For Investors?
- If you are wondering whether Fastenal is still attractively priced today, or if the easy gains are behind it, you are not alone. This article will break down what the current share price implies about potential future returns.
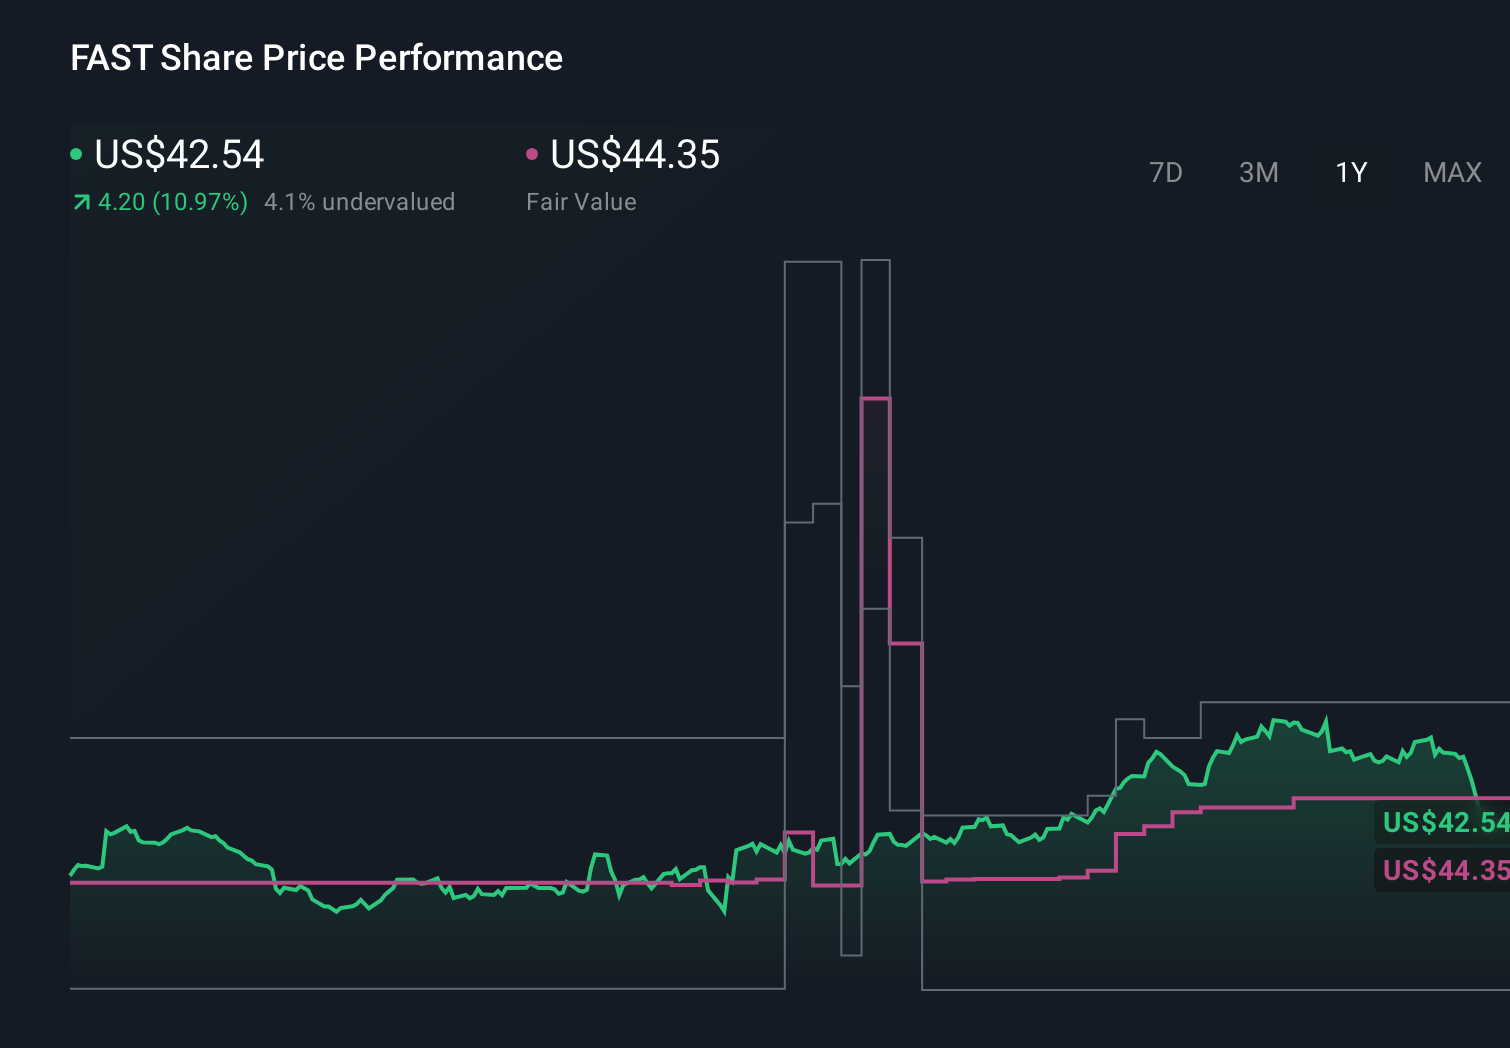
- The stock has climbed 1.2% over the last week, 3.9% over the past month, and is up 18.2% year to date, adding to a 9.3% 1-year gain and nearly doubling investors' money over 3- and 5-year periods with returns of 89.2% and 92.1% respectively.
- Behind those moves, the market has been reacting to a steady stream of headlines around industrial activity, construction demand, and reshoring trends in North America, all of which can benefit a large distributor of fasteners and industrial supplies like Fastenal. Investors are also weighing how management's ongoing investments in onsite locations, vending solutions, and supply chain efficiency could influence growth as economic conditions evolve.
- Yet despite that track record, Fastenal currently scores just 0/6 on our valuation checks, which suggests the market may be paying up for quality. Next, we will walk through what different valuation approaches indicate about the stock today, and later on we will look at a more holistic way to judge whether the current price makes sense.
Fastenal scores just 0/6 on our valuation checks. See what other red flags we found in the full valuation breakdown.
Approach 1: Fastenal Discounted Cash Flow (DCF) Analysis
A Discounted Cash Flow model estimates what a business is worth by projecting the cash it can generate in the future and discounting those cash flows back to today. For Fastenal, the model uses a 2 Stage Free Cash Flow to Equity approach built on its latest twelve month free cash flow of about $990.2 Million. It then grows those cash flows based on analyst forecasts and longer term assumptions.
Analysts see free cash flow rising to around $1.41 Billion by 2029, with intermediate projections such as roughly $1.11 Billion in 2026 and $1.22 Billion in 2027. After that, Simply Wall St extrapolates more moderate growth beyond the explicit forecast period. All figures are in $ and reflect the cash that could in theory be returned to shareholders after necessary reinvestment.
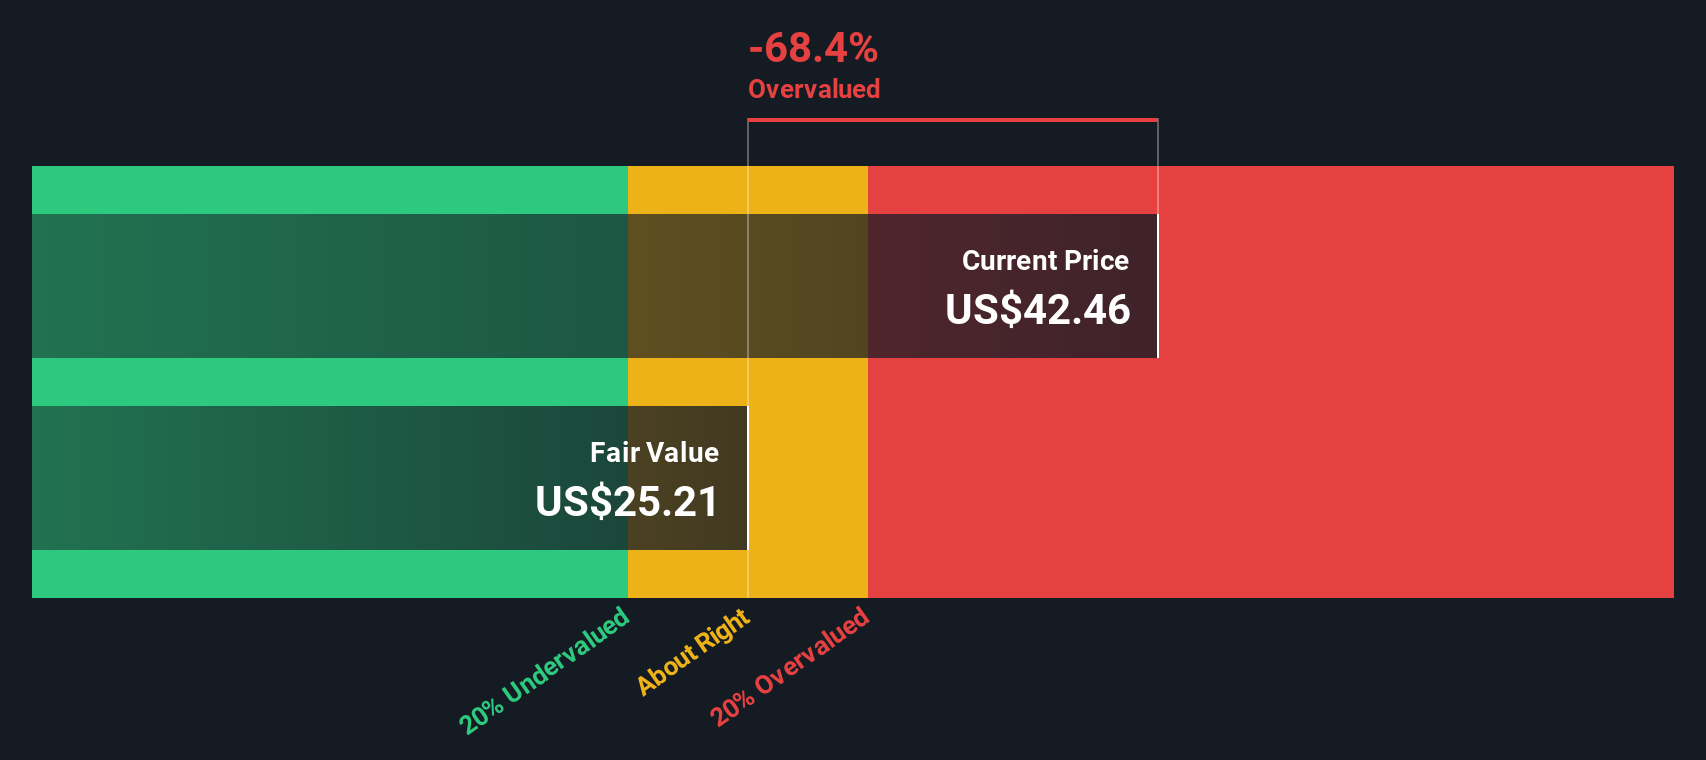
When these projected cash flows are discounted back, the model arrives at an intrinsic value of about $25.19 per share. Compared with the current market price, this implies Fastenal is roughly 66.8% overvalued on a DCF basis. This suggests investors are currently paying a steep premium for its quality and consistency.
Result: OVERVALUED
Our Discounted Cash Flow (DCF) analysis suggests Fastenal may be overvalued by 66.8%. Discover 908 undervalued stocks or create your own screener to find better value opportunities.
Approach 2: Fastenal Price vs Earnings
For a mature, consistently profitable company like Fastenal, the Price to Earnings (PE) ratio is a natural way to judge valuation because it links the share price directly to the profits each share is entitled to. In general, faster growing, lower risk companies tend to have higher PE ratios, while slower growing or riskier businesses tend to trade on lower multiples.
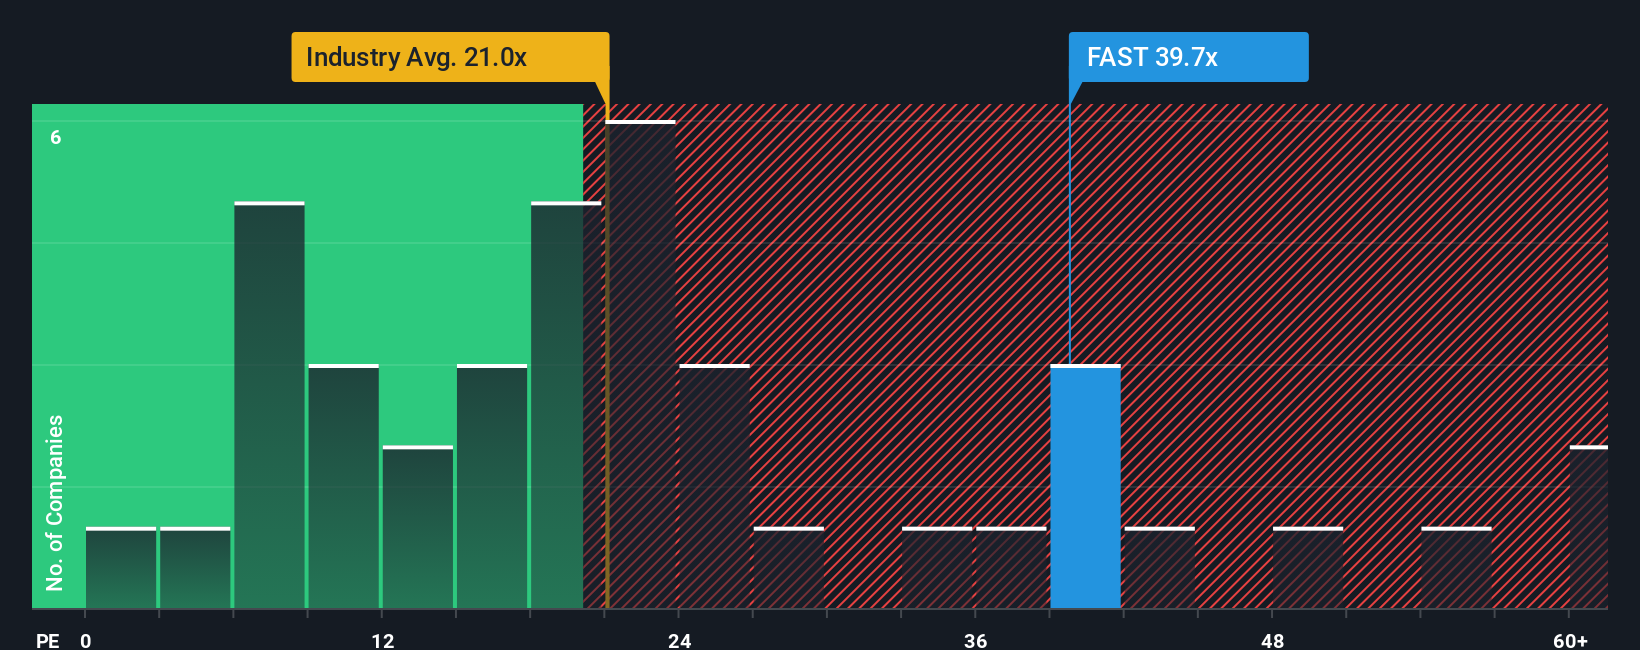
Fastenal currently trades on a PE of about 39.3x, which is roughly double the Trade Distributors industry average of around 19.9x and well above the peer group average of about 20.3x. On the surface, that points to a rich valuation. However, Simply Wall St also calculates a proprietary Fair Ratio of 26.7x, which reflects what PE might be reasonable given Fastenal’s specific earnings growth profile, margins, industry, market cap and risk characteristics.
This Fair Ratio is more informative than a simple peer or industry comparison because it adjusts for the fact that not all distributors grow or earn profits at the same pace, nor face the same risks. Comparing Fastenal’s current 39.3x PE to its 26.7x Fair Ratio suggests the shares are trading materially above what its fundamentals justify. This indicates the market is paying a premium that may be hard to sustain.
Result: OVERVALUED
PE ratios tell one story, but what if the real opportunity lies elsewhere? Discover 1445 companies where insiders are betting big on explosive growth.
Upgrade Your Decision Making: Choose your Fastenal Narrative
Earlier we mentioned that there is an even better way to understand valuation, so let us introduce you to Narratives, a simple framework on Simply Wall St’s Community page that lets you connect your view of Fastenal’s story to specific assumptions for future revenue, earnings and margins. You can roll those into a forecast and a fair value, and then compare that fair value to today’s price to decide whether to buy, hold or sell. The numbers automatically update as new news or earnings arrive. For example, an optimistic investor might build a Narrative that assumes resilient margins, sustained high single digit revenue growth and a fair value closer to the bullish target of about $53. A more cautious investor might focus on slowing sales, pressure on gross margins and a fair value nearer the bearish target of roughly $29.50. This illustrates how different yet clearly articulated perspectives can coexist and be tracked over time using the same intuitive, dynamic tool.
Do you think there's more to the story for Fastenal? Head over to our Community to see what others are saying!
This article by Simply Wall St is general in nature. We provide commentary based on historical data and analyst forecasts only using an unbiased methodology and our articles are not intended to be financial advice. It does not constitute a recommendation to buy or sell any stock, and does not take account of your objectives, or your financial situation. We aim to bring you long-term focused analysis driven by fundamental data. Note that our analysis may not factor in the latest price-sensitive company announcements or qualitative material. Simply Wall St has no position in any stocks mentioned.
Have feedback on this article? Concerned about the content? Get in touch with us directly. Alternatively, email editorial-team@simplywallst.com