
- LIVE QUOTES
- LEARN
- HELP
 Nasdaq
 Wall Street Journal
EN
Is Hexcel Still Attractive After Recent Share Price Swings and Strong DCF Outlook?
- Wondering if Hexcel at around $73 a share is still a smart buy, or if the best gains are already behind it? Here is a breakdown of what the recent moves and fundamentals may be indicating about its value.
- Hexcel's share price is up 18.2% year to date and 15.9% over the last year, even after a recent 4.6% dip in the past week that follows a 5.7% gain over the last month.
- These swings are happening against a backdrop of steady demand for advanced composite materials in aerospace and defense, where Hexcel is a key supplier. Investors have been reacting to contract wins and broader optimism about aircraft build rates and defense spending, which helps explain why the stock has drifted higher over the last few years despite occasional pullbacks.
- On our checks, Hexcel scores just 2/6 on valuation, meaning it only looks undervalued on a couple of traditional metrics. Next, we unpack what those different valuation approaches are indicating and introduce a more nuanced way to think about Hexcel's worth by the end of the article.
Hexcel scores just 2/6 on our valuation checks. See what other red flags we found in the full valuation breakdown.
Approach 1: Hexcel Discounted Cash Flow (DCF) Analysis
A Discounted Cash Flow model estimates what a business is worth by projecting the cash it can generate in the future and discounting those cash flows back to today in dollar terms. For Hexcel, the 2 Stage Free Cash Flow to Equity model starts with last twelve month free cash flow of about $176.5 million and assumes this will grow steadily as aerospace and defense demand improves.
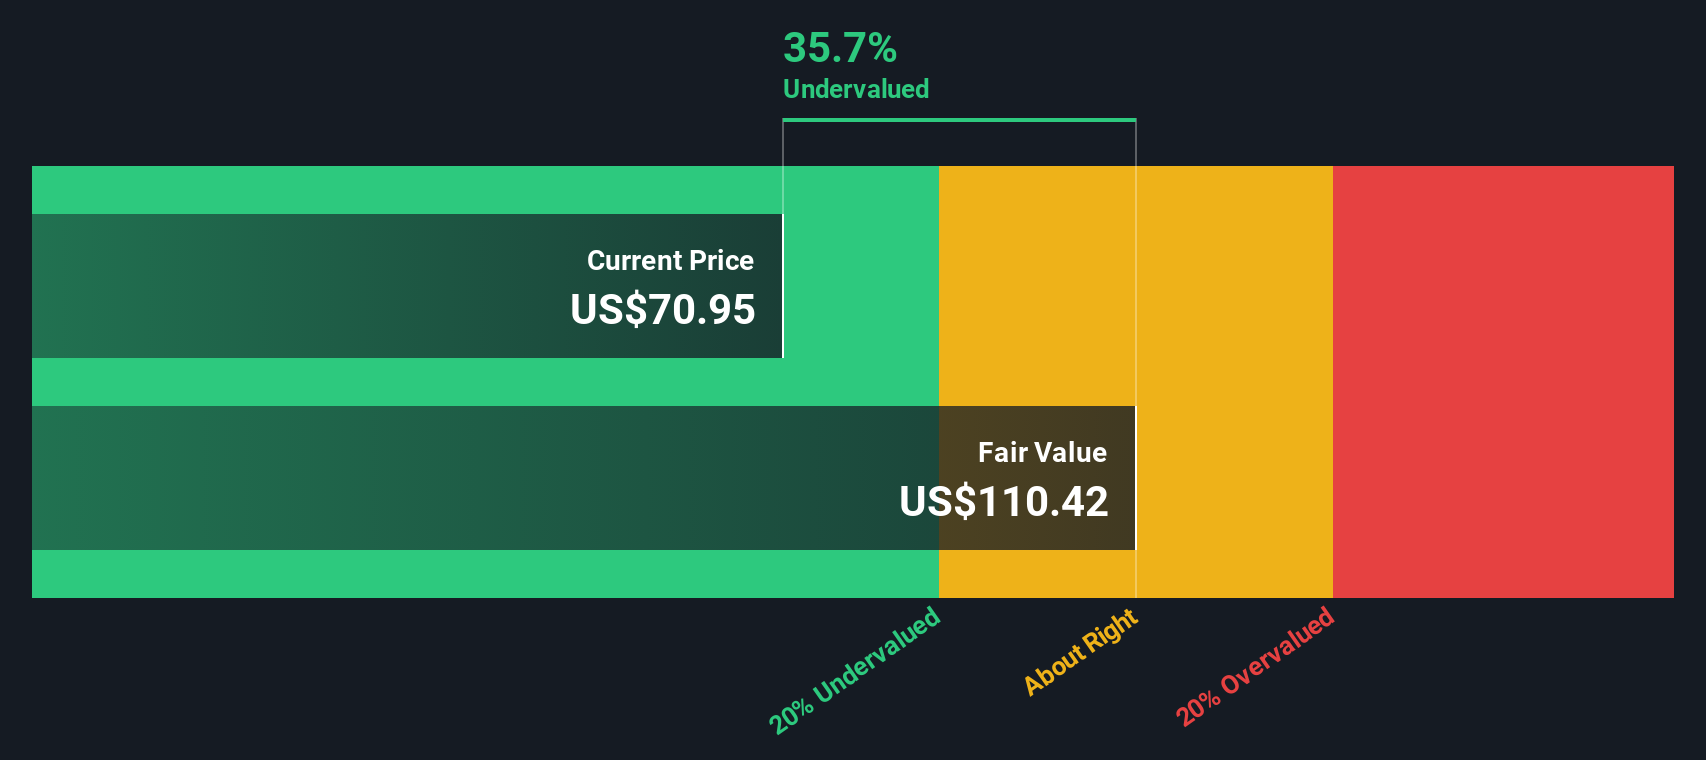
Analysts provide detailed forecasts for the next few years, with free cash flow expected to reach roughly $222.2 million in 2026 and $310.4 million by 2028. Beyond that, Simply Wall St extrapolates further out, with projections rising toward about $483.9 million by 2035 as growth gradually tapers. All of these future cash flows are discounted back to arrive at an estimated intrinsic value of roughly $95.34 per share.
Compared with the recent share price around $73, the DCF suggests Hexcel is about 23.4% undervalued. This indicates the market may be underestimating its long term cash generation power.
Result: UNDERVALUED
Our Discounted Cash Flow (DCF) analysis suggests Hexcel is undervalued by 23.4%. Track this in your watchlist or portfolio, or discover 908 more undervalued stocks based on cash flows.
Approach 2: Hexcel Price vs Earnings
For a profitable company like Hexcel, the price to earnings ratio is a useful yardstick because it ties the share price directly to the earnings that shareholders ultimately rely on. Investors typically accept a higher PE when they expect stronger growth or see the business as relatively low risk, while slower growth or higher uncertainty tends to justify a lower, more conservative PE.
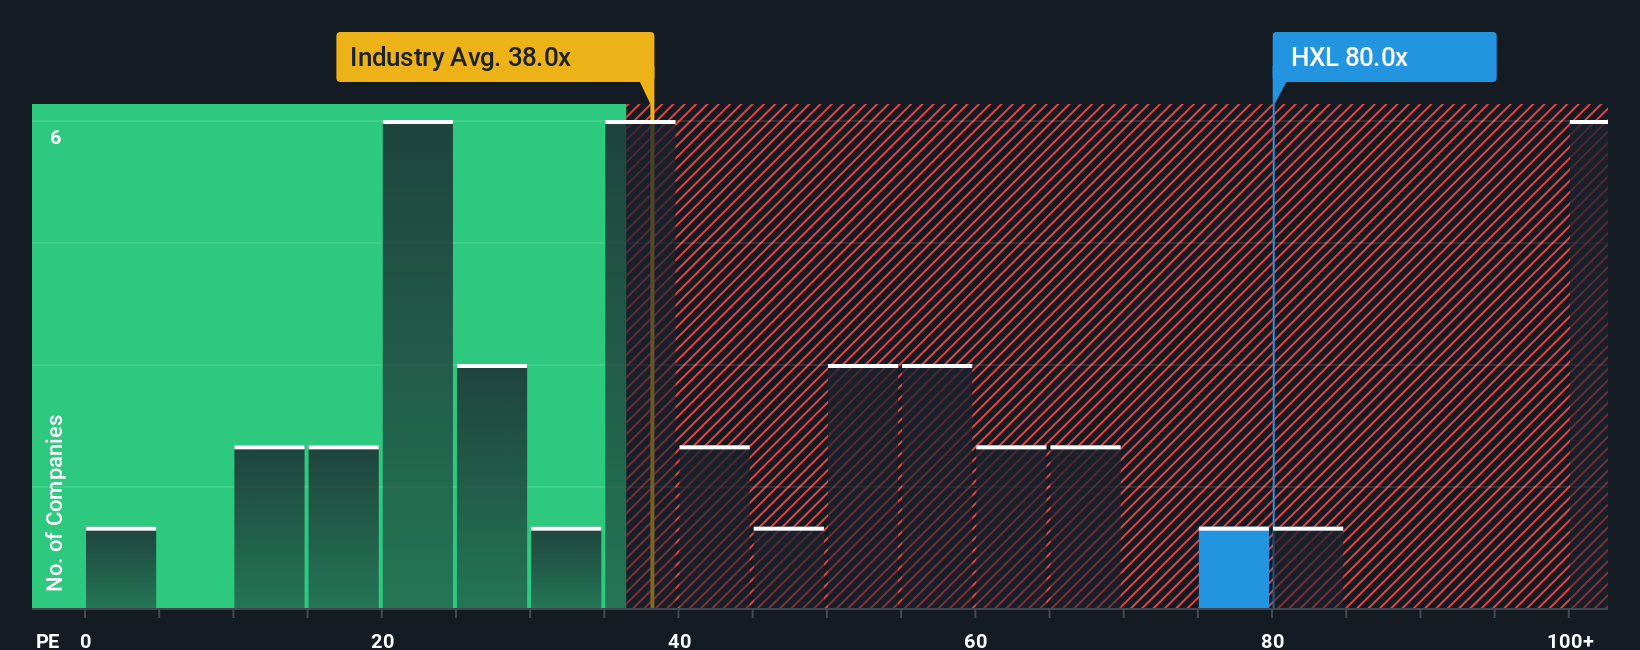
Hexcel currently trades on a PE of about 84.5x, which is well above the Aerospace and Defense industry average of roughly 38.7x and higher than the peer group average of about 55.3x. Simply Wall St also estimates a Fair Ratio for Hexcel of around 38.4x, which reflects what its PE might reasonably be given its growth outlook, profitability, industry, size and risk profile.
This Fair Ratio is more tailored than a simple comparison with peers or the wider industry, because it adjusts for the specific characteristics of Hexcel rather than assuming all companies deserve the same multiple. Set against this 38.4x Fair Ratio, the current 84.5x PE suggests that, on an earnings multiple basis, Hexcel looks significantly overvalued.
Result: OVERVALUED
PE ratios tell one story, but what if the real opportunity lies elsewhere? Discover 1445 companies where insiders are betting big on explosive growth.
Upgrade Your Decision Making: Choose your Hexcel Narrative
Earlier we mentioned that there is an even better way to understand valuation, so let's introduce you to Narratives, a simple way to connect your view of Hexcel's story with a set of numbers like future revenue, earnings, margins and a fair value, all within Simply Wall St's Community page that millions of investors use. A Narrative is essentially your investment storyline backed by a forecast; it turns your expectations about aircraft build rates, defense demand, cost control, and buybacks into a concrete model that produces a Fair Value you can compare with today’s share price to decide whether Hexcel is a buy, hold, or sell. Because Narratives on Simply Wall St update dynamically when new information arrives such as guidance changes, analyst revisions, or news about the CFO transition and buyback progress, your fair value view stays aligned with reality instead of going stale. For example, a bullish Hexcel Narrative might lean toward the higher end of analyst assumptions, closer to the $80 price target with stronger margin expansion and cash flows. In contrast, a more cautious Narrative might anchor near the $55 target and build in slower revenue growth, tighter margins, and more conservative expectations for buybacks and execution risk.
Do you think there's more to the story for Hexcel? Head over to our Community to see what others are saying!

This article by Simply Wall St is general in nature. We provide commentary based on historical data and analyst forecasts only using an unbiased methodology and our articles are not intended to be financial advice. It does not constitute a recommendation to buy or sell any stock, and does not take account of your objectives, or your financial situation. We aim to bring you long-term focused analysis driven by fundamental data. Note that our analysis may not factor in the latest price-sensitive company announcements or qualitative material. Simply Wall St has no position in any stocks mentioned.
Have feedback on this article? Concerned about the content? Get in touch with us directly. Alternatively, email editorial-team@simplywallst.com