
- LIVE QUOTES
- LEARN
- HELP
 Nasdaq
 Wall Street Journal
EN
Pan Pacific International Holdings (TSE:7532): Valuation Check After Solid November 2025 Sales Growth Across Segments
Pan Pacific International Holdings (TSE:7532) just released its November 2025 trading update, showing year over year sales growth across domestic, discount, and UNY segments, a data point investors cannot really ignore.
See our latest analysis for Pan Pacific International Holdings.
That solid sales update seems to be steadying sentiment, with the share price at ¥964.9 after a modest recent recovery. However, the 90 day share price return of minus 8% shows momentum has cooled, even as the five year total shareholder return of 109.3% still points to a strong long term story.
If Pan Pacific’s numbers have you thinking about what else is executing well in retail and beyond, this could be a good moment to explore fast growing stocks with high insider ownership for more potential ideas.
Yet with earnings still growing and the shares trading below analyst price targets, investors now face a key question: Is Pan Pacific undervalued after its pullback, or is the market already pricing in the next leg of growth?
Price-to-Earnings of 29.3x: Is it justified?
On a price-to-earnings basis, Pan Pacific International Holdings trades on 29.3x earnings at ¥964.9 per share, placing it on a clear valuation premium versus peers.
The price to earnings multiple compares the current share price with the company’s per share earnings, making it a useful shorthand for how much investors are paying for each unit of profit. For a mature multiline retailer like Pan Pacific, this multiple reflects what the market is willing to pay today for its established, growing earnings base.
Here, investors are paying 29.3 times Pan Pacific’s earnings, which strongly suggests the market is assuming continued profit growth and sustained execution rather than treating the company as a low growth retailer. However, our estimates indicate that a fair price to earnings level, based on fundamentals, would be closer to 24.3x, implying the current premium may be running ahead of that fair ratio.
Relative to the broader JP Multiline Retail industry average of 15.8x, Pan Pacific’s 29.3x multiple stands at an elevated level, almost double what is typical for the sector. The stock also screens as more expensive than its direct peer group, where the average price to earnings ratio sits around 20.5x. This reinforces the view that investors are paying a substantial premium for its growth and quality profile.
Explore the SWS fair ratio for Pan Pacific International Holdings
Result: Price-to-Earnings of 29.3x (OVERVALUED)
However, risks remain around a premium valuation if growth slows. Any earnings disappointment or weaker consumer spending could potentially trigger a sharper de-rating.
Find out about the key risks to this Pan Pacific International Holdings narrative.
Another View: What Our DCF Suggests
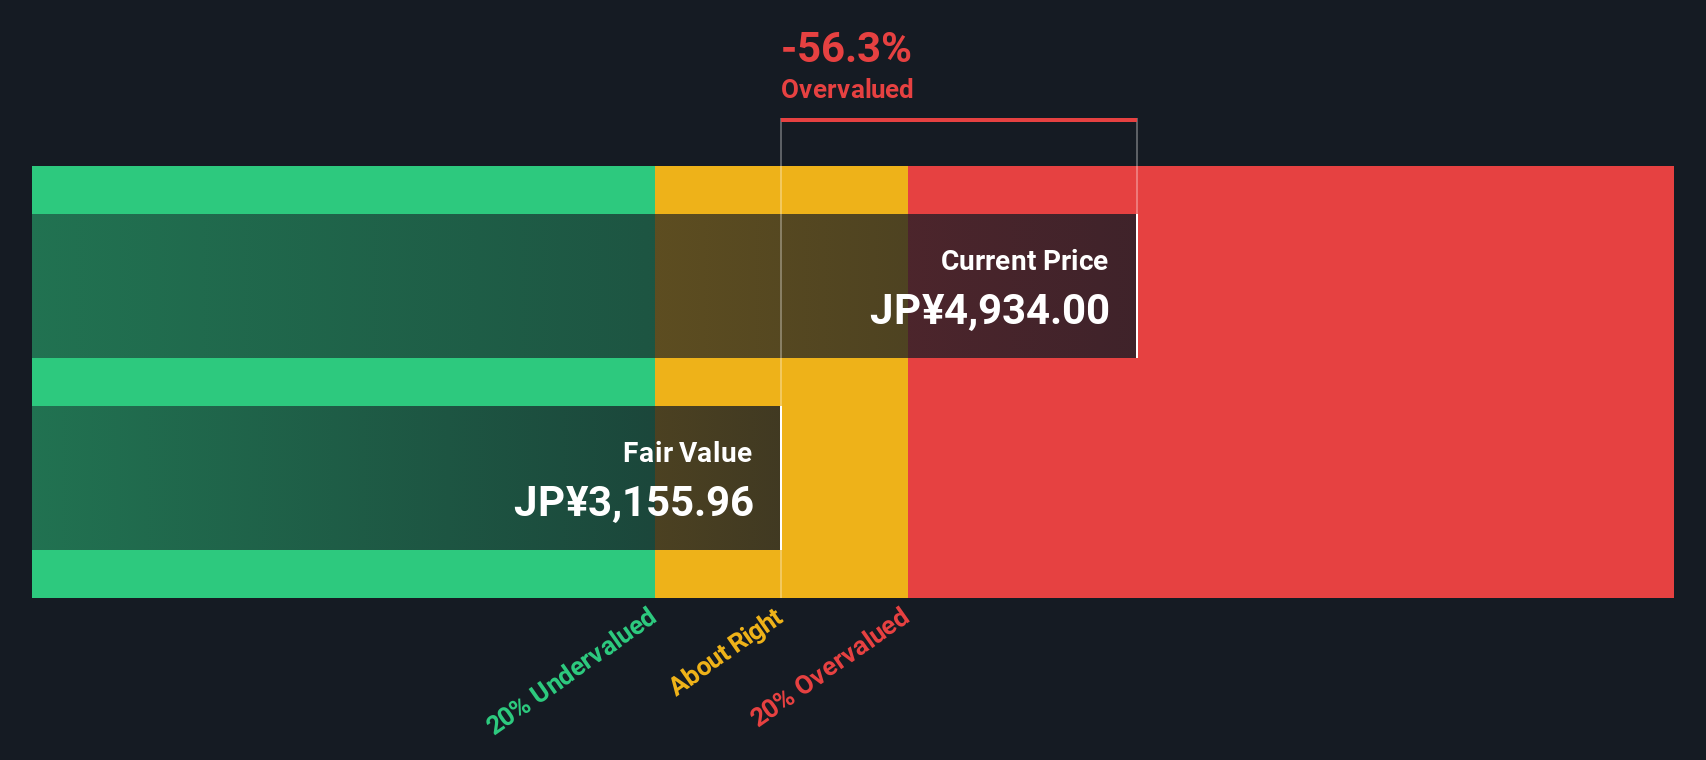
Our DCF model paints a starker picture, putting fair value for Pan Pacific closer to ¥647 per share, well below the current ¥964.9 price. That points to the stock being overvalued on cash flow assumptions and raises the question of whether today’s growth can really support this premium.
Look into how the SWS DCF model arrives at its fair value.
Simply Wall St performs a discounted cash flow (DCF) on every stock in the world every day (check out Pan Pacific International Holdings for example). We show the entire calculation in full. You can track the result in your watchlist or portfolio and be alerted when this changes, or use our stock screener to discover 908 undervalued stocks based on their cash flows. If you save a screener we even alert you when new companies match - so you never miss a potential opportunity.
Build Your Own Pan Pacific International Holdings Narrative
If this perspective does not fully align with your own, or you would rather rely on your own analysis, you can quickly build a tailored view in under three minutes: Do it your way.
A good starting point is our analysis highlighting 2 key rewards investors are optimistic about regarding Pan Pacific International Holdings.
Looking for more high conviction ideas?
Do not stop at one stock. Use the Simply Wall St Screener to uncover more focused opportunities that could sharpen your next investing move.
- Capture early stage growth potential by targeting these 3612 penny stocks with strong financials that already show solid financial underpinnings and room to scale.
- Tap into structural change in technology by zeroing in on these 26 AI penny stocks positioned to benefit as artificial intelligence rolls into the mainstream.
- Lock in a stronger income stream by filtering for these 13 dividend stocks with yields > 3% that can support yields above inflation while still maintaining balance sheet discipline.
This article by Simply Wall St is general in nature. We provide commentary based on historical data and analyst forecasts only using an unbiased methodology and our articles are not intended to be financial advice. It does not constitute a recommendation to buy or sell any stock, and does not take account of your objectives, or your financial situation. We aim to bring you long-term focused analysis driven by fundamental data. Note that our analysis may not factor in the latest price-sensitive company announcements or qualitative material. Simply Wall St has no position in any stocks mentioned.
Have feedback on this article? Concerned about the content? Get in touch with us directly. Alternatively, email editorial-team@simplywallst.com