
- LIVE QUOTES
- LEARN
- HELP
 Nasdaq
 Wall Street Journal
EN
Is There Now an Opportunity in Crocs After Recent Share Price Volatility?
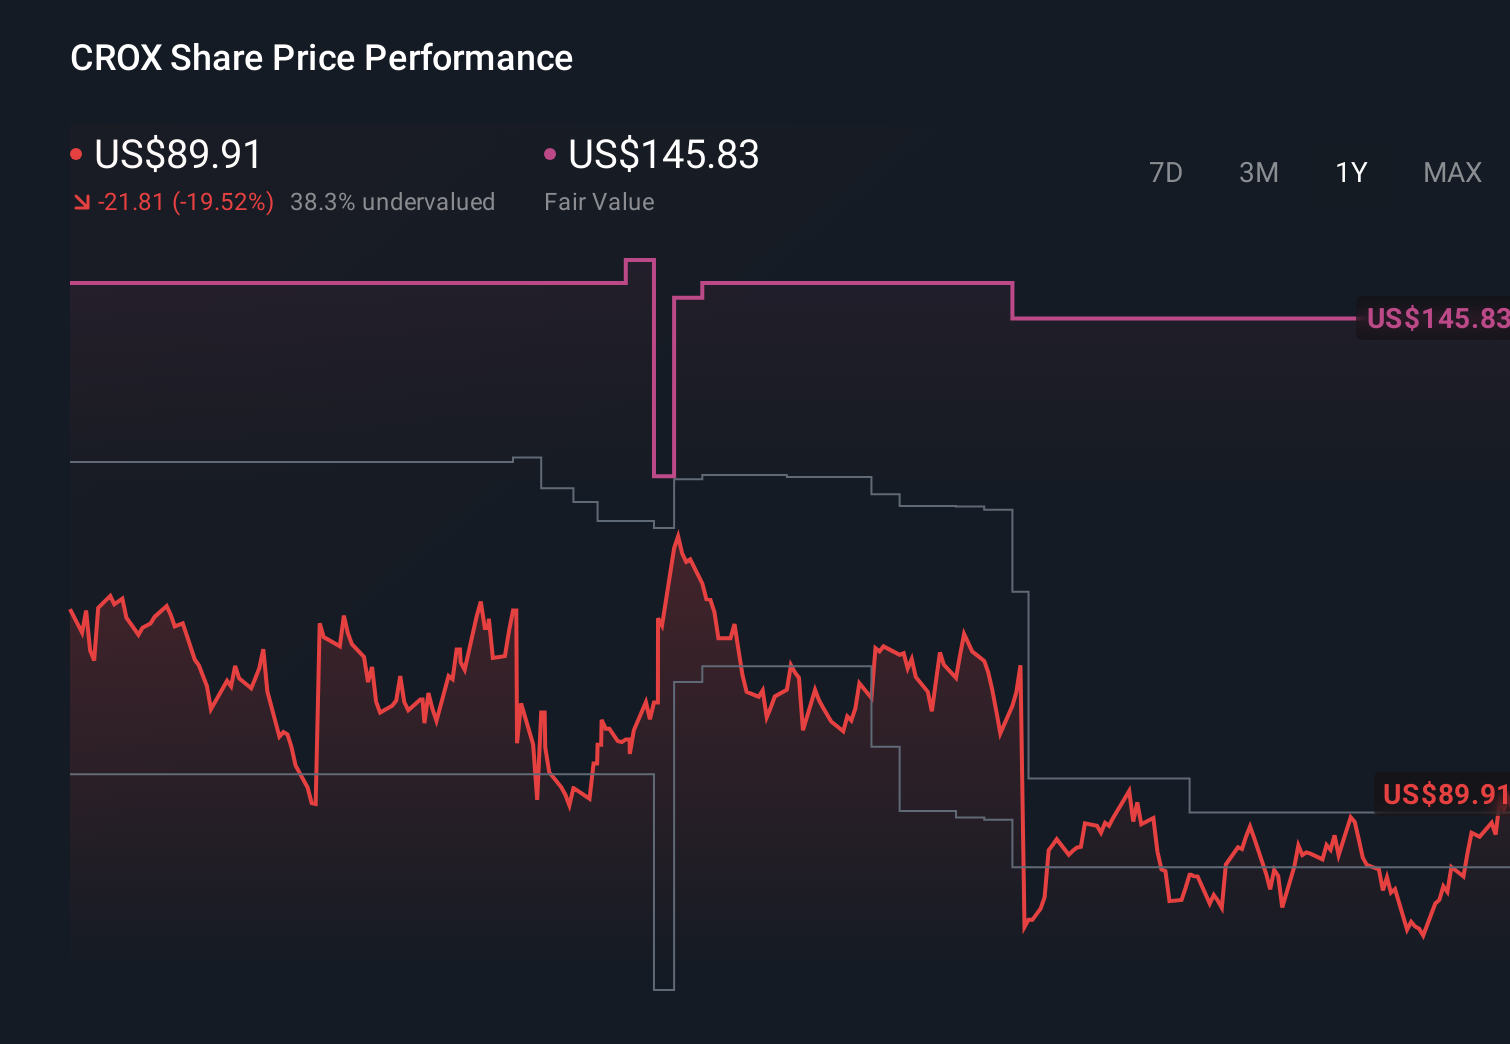
- Wondering if Crocs at around $89.91 is a bargain or a value trap? You are not alone, and that is exactly what this breakdown is going to tackle.
- The stock has been choppy, up 0.2% over the last week and 22.5% over the last month, yet still down 18.3% year to date and 19.5% over the past year, which raises fresh questions about both upside potential and perceived risk.
- Recent commentary has focused on how Crocs continues to lean on its brand strength and product innovation, from classic clogs to newer lines that target more fashion conscious consumers. At the same time, analysts and investors have been reassessing how durable that growth story is in a more competitive casual footwear landscape, helping to explain the mixed share price performance.
- On our framework, Crocs scores a 3/6 valuation check, suggesting it screens as undervalued on several, but not all, metrics. We will unpack those traditional valuation approaches next, and then point to a more complete way of thinking about fair value at the end of this article.
Find out why Crocs's -19.5% return over the last year is lagging behind its peers.
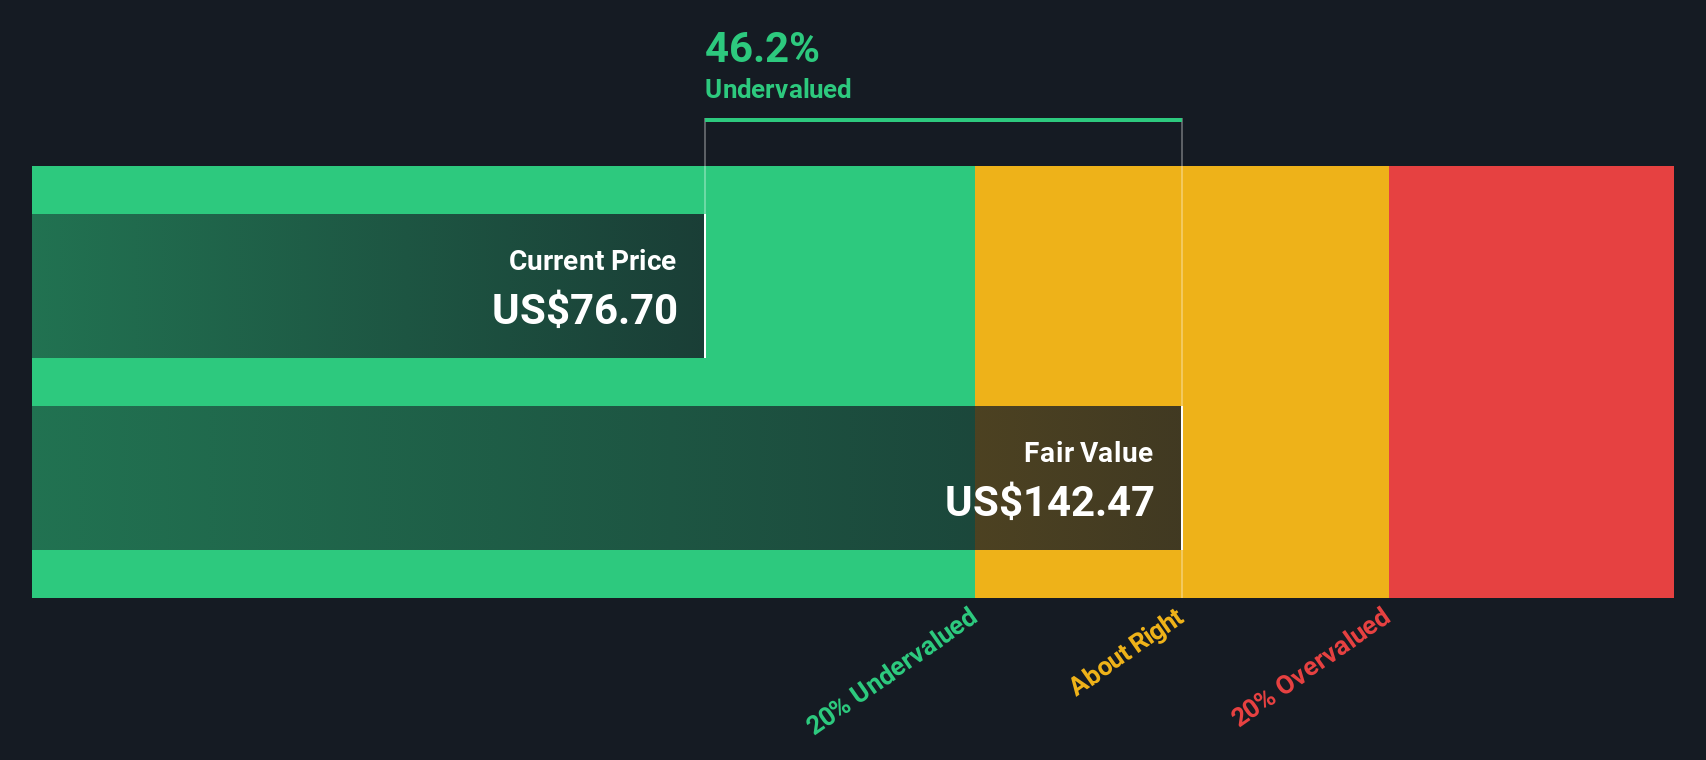
Approach 1: Crocs Discounted Cash Flow (DCF) Analysis
A Discounted Cash Flow model estimates what a company is worth today by projecting its future cash flows and discounting them back to the present using a required rate of return. For Crocs, the 2 Stage Free Cash Flow to Equity model starts with last twelve month free cash flow of about $697.4 Million, then uses analyst forecasts and longer term assumptions to map how that cash might evolve.
Analysts currently project free cash flow of roughly $624.6 Million in 2026 and $626.0 Million in 2027, with Simply Wall St extrapolating more moderate movements thereafter, reaching around $675.6 Million by 2035. When all of those future cash flows are discounted back to today, the model arrives at an intrinsic value of about $158.70 per share.
Compared with the recent share price near $89.91, this implies Crocs is trading at roughly a 43.3% discount to its DCF based fair value. This suggests the market is heavily discounting the company’s ability to sustain these cash flows.
Result: UNDERVALUED
Our Discounted Cash Flow (DCF) analysis suggests Crocs is undervalued by 43.3%. Track this in your watchlist or portfolio, or discover 908 more undervalued stocks based on cash flows.
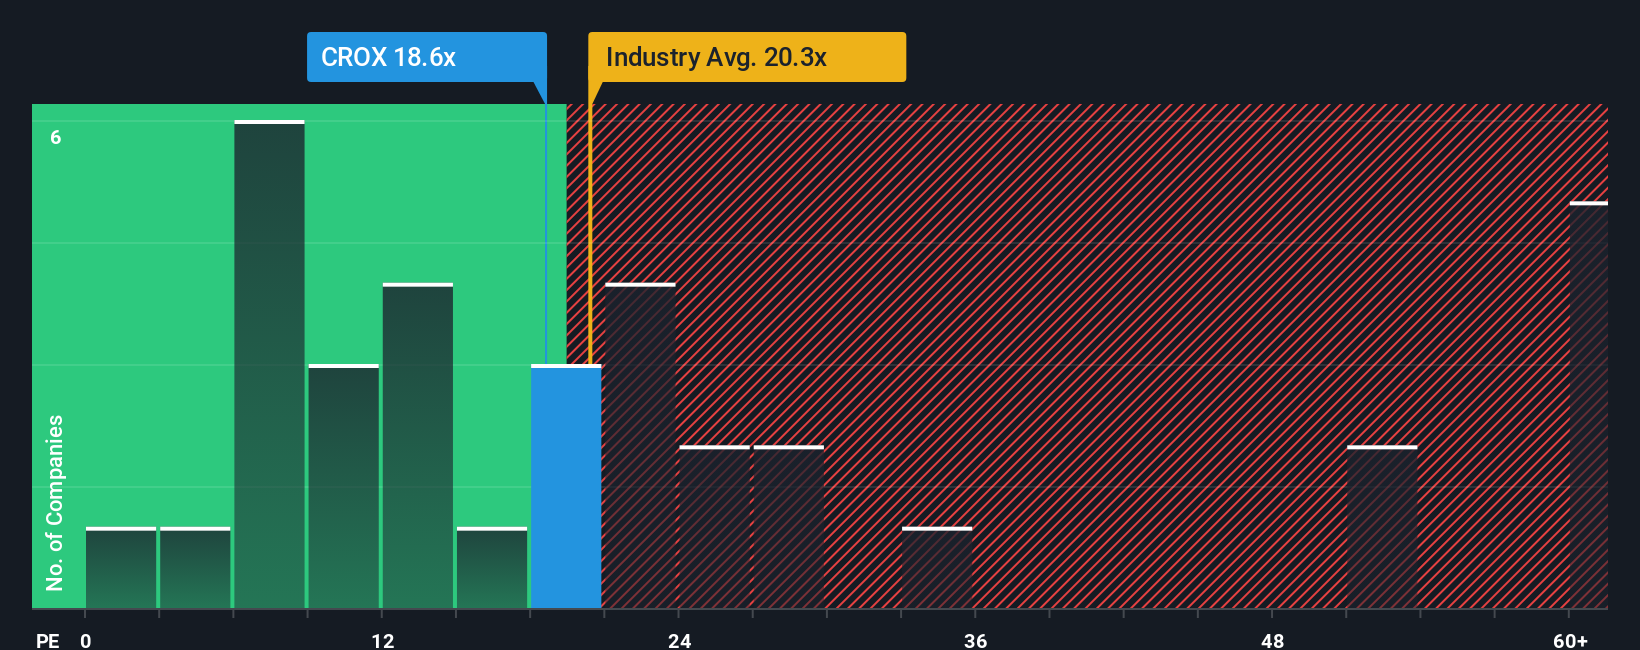
Approach 2: Crocs Price vs Earnings
For profitable companies like Crocs, the price to earnings ratio is a useful reality check because it ties the share price directly to what the business is actually earning today. Investors are generally willing to pay a higher PE when they expect stronger, more reliable growth, and a lower PE when they see higher risks or more volatile earnings. What counts as a fair multiple therefore depends on both the outlook and the uncertainty around it.
Crocs currently trades on a PE of about 25.6x, a touch above both the Luxury industry average near 22.4x and the peer group average around 24.1x. Simply Wall St also calculates a Fair Ratio for Crocs of roughly 59.7x, which is a proprietary estimate of the PE you might expect once you factor in its earnings growth profile, margins, risk characteristics, industry and size. This Fair Ratio provides a more tailored benchmark than simple peer or industry comparisons because it attempts to align the multiple with Crocs specific fundamentals rather than broad sector snapshots. Comparing the current 25.6x PE to the 59.7x Fair Ratio points to the market pricing Crocs at a meaningful discount to where its fundamentals might justify.
Result: UNDERVALUED
PE ratios tell one story, but what if the real opportunity lies elsewhere? Discover 1445 companies where insiders are betting big on explosive growth.
Upgrade Your Decision Making: Choose your Crocs Narrative
Earlier we mentioned that there is an even better way to understand valuation, so let us introduce you to Narratives, which are simply the stories investors tell about a company that sit behind the numbers they plug into their fair value, revenue, earnings and margin assumptions.
A Narrative on Simply Wall St links three things together: the business story you believe, the financial forecast that flows from that story, and the fair value estimate that falls out of those forecasts. This way, you can clearly see how your view of Crocs turns into a number you can compare to today’s share price.
These Narratives are easy to create and explore on the Simply Wall St Community page, where millions of investors already share their perspectives. They also update dynamically when new information like earnings, guidance or news hits, so your view is never stuck in the past.
For example, one Crocs Narrative on the Community might assume modest 3 percent annual revenue growth, a 20 percent profit margin and a 10x future PE to reach a fair value of about $151.43. Another Narrative might lean on more cautious analyst style assumptions that translate to a fair value closer to roughly $89.75. By comparing each Narrative’s fair value to the current price, you can quickly decide whether the stock looks like a buy, hold or sell under that specific story.
For Crocs however we will make it really easy for you with previews of two leading Crocs Narratives:
Fair value: $151.43 per share
Implied undervaluation vs current price: 40.6%
Revenue growth assumption: 3%
- Assumes steady 3% annual revenue growth driven primarily by continued international expansion in Asia and Europe and deeper penetration of emerging markets.
- Builds in a robust 20% long term net profit margin supported by strong gross margins and a growing direct to consumer mix that reduces reliance on wholesale channels.
- Applies a conservative 10x future PE and 10% discount rate, and arrives at a $151.43 fair value that reflects potential upside if Crocs executes on its growth and margin plans.
Fair value: $89.75 per share
Implied overvaluation vs current price: 0.2%
Revenue growth assumption: -0.64%
- Uses assumptions that revenues will contract slightly over time as North American demand remains pressured and fashion and competitive headwinds persist.
- Balances strong margin and DTC improvement potential with material risks from HEYDUDE underperformance, tariff exposure, shifting consumer preferences and sustainability concerns.
- Translates these assumptions into a fair value of about $89.75, only slightly above the current share price, suggesting limited upside unless execution and demand trends improve more than expected.
Do you think there's more to the story for Crocs? Head over to our Community to see what others are saying!
This article by Simply Wall St is general in nature. We provide commentary based on historical data and analyst forecasts only using an unbiased methodology and our articles are not intended to be financial advice. It does not constitute a recommendation to buy or sell any stock, and does not take account of your objectives, or your financial situation. We aim to bring you long-term focused analysis driven by fundamental data. Note that our analysis may not factor in the latest price-sensitive company announcements or qualitative material. Simply Wall St has no position in any stocks mentioned.
Have feedback on this article? Concerned about the content? Get in touch with us directly. Alternatively, email editorial-team@simplywallst.com