
- LIVE QUOTES
- LEARN
- HELP
 Nasdaq
 Wall Street Journal
EN
Institutional investors have a lot riding on Magna International Inc. (TSE:MG) with 73% ownership
Key Insights
- Institutions' substantial holdings in Magna International implies that they have significant influence over the company's share price
- The top 25 shareholders own 49% of the company
- Analyst forecasts along with ownership data serve to give a strong idea about prospects for a business
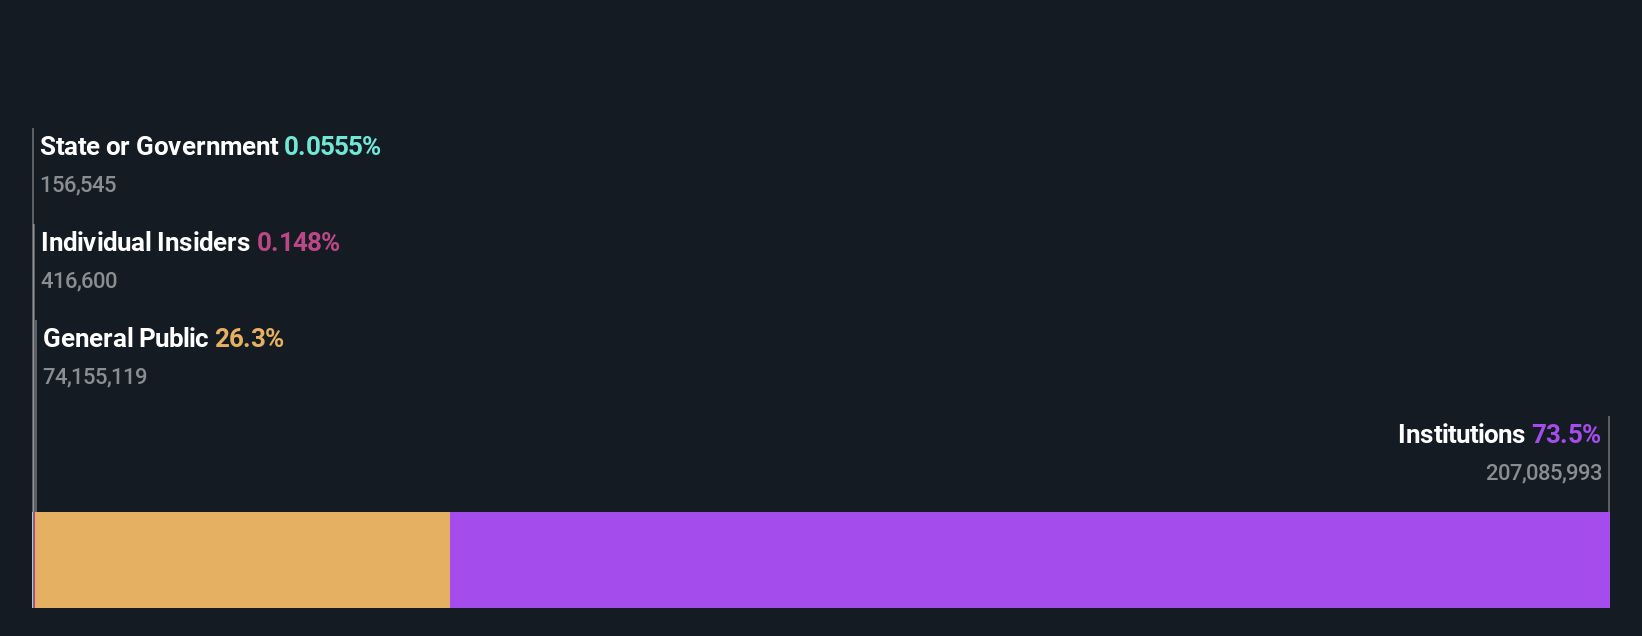
Every investor in Magna International Inc. (TSE:MG) should be aware of the most powerful shareholder groups. And the group that holds the biggest piece of the pie are institutions with 73% ownership. That is, the group stands to benefit the most if the stock rises (or lose the most if there is a downturn).
And as as result, institutional investors reaped the most rewards after the company's stock price gained 5.3% last week. The one-year return on investment is currently 19% and last week's gain would have been more than welcomed.
In the chart below, we zoom in on the different ownership groups of Magna International.
View our latest analysis for Magna International
What Does The Institutional Ownership Tell Us About Magna International?
Many institutions measure their performance against an index that approximates the local market. So they usually pay more attention to companies that are included in major indices.
Magna International already has institutions on the share registry. Indeed, they own a respectable stake in the company. This can indicate that the company has a certain degree of credibility in the investment community. However, it is best to be wary of relying on the supposed validation that comes with institutional investors. They too, get it wrong sometimes. It is not uncommon to see a big share price drop if two large institutional investors try to sell out of a stock at the same time. So it is worth checking the past earnings trajectory of Magna International, (below). Of course, keep in mind that there are other factors to consider, too.

Investors should note that institutions actually own more than half the company, so they can collectively wield significant power. Magna International is not owned by hedge funds. The company's largest shareholder is Pzena Investment Management, Inc., with ownership of 10%. Meanwhile, the second and third largest shareholders, hold 4.3% and 3.8%, of the shares outstanding, respectively.
A deeper look at our ownership data shows that the top 25 shareholders collectively hold less than half of the register, suggesting a large group of small holders where no single shareholder has a majority.
While it makes sense to study institutional ownership data for a company, it also makes sense to study analyst sentiments to know which way the wind is blowing. There are a reasonable number of analysts covering the stock, so it might be useful to find out their aggregate view on the future.
Insider Ownership Of Magna International
The definition of company insiders can be subjective and does vary between jurisdictions. Our data reflects individual insiders, capturing board members at the very least. Company management run the business, but the CEO will answer to the board, even if he or she is a member of it.
Insider ownership is positive when it signals leadership are thinking like the true owners of the company. However, high insider ownership can also give immense power to a small group within the company. This can be negative in some circumstances.
Our data suggests that insiders own under 1% of Magna International Inc. in their own names. It is a very large company, so it would be surprising to see insiders own a large proportion of the company. Though their holding amounts to less than 1%, we can see that board members collectively own CA$30m worth of shares (at current prices). Arguably recent buying and selling is just as important to consider. You can click here to see if insiders have been buying or selling.
General Public Ownership
The general public-- including retail investors -- own 26% stake in the company, and hence can't easily be ignored. This size of ownership, while considerable, may not be enough to change company policy if the decision is not in sync with other large shareholders.
Next Steps:
It's always worth thinking about the different groups who own shares in a company. But to understand Magna International better, we need to consider many other factors.
I like to dive deeper into how a company has performed in the past. You can find historic revenue and earnings in this detailed graph.
If you are like me, you may want to think about whether this company will grow or shrink. Luckily, you can check this free report showing analyst forecasts for its future.
NB: Figures in this article are calculated using data from the last twelve months, which refer to the 12-month period ending on the last date of the month the financial statement is dated. This may not be consistent with full year annual report figures.
Have feedback on this article? Concerned about the content? Get in touch with us directly. Alternatively, email editorial-team (at) simplywallst.com.
This article by Simply Wall St is general in nature. We provide commentary based on historical data and analyst forecasts only using an unbiased methodology and our articles are not intended to be financial advice. It does not constitute a recommendation to buy or sell any stock, and does not take account of your objectives, or your financial situation. We aim to bring you long-term focused analysis driven by fundamental data. Note that our analysis may not factor in the latest price-sensitive company announcements or qualitative material. Simply Wall St has no position in any stocks mentioned.