
- LIVE QUOTES
- LEARN
- HELP
 Nasdaq
 Wall Street Journal
EN
CNA Financial (CNA): Reassessing Valuation After Fed Rate Cut Boosts Insurance Stocks
CNA Financial (CNA) climbed about 3% after the Federal Reserve cut its benchmark rate by 25 basis points, a move that immediately brightened sentiment toward rate sensitive financial and insurance names.
See our latest analysis for CNA Financial.
That move slots into a more mixed backdrop, with CNA’s share price up solidly over the past week but still lower year to date. Longer term total shareholder returns remain comfortably positive, hinting at steady compounding rather than surging momentum.
If you are reassessing your financials exposure after the Fed shift, it could also be worth exploring fast growing stocks with high insider ownership for other potentially compelling ideas.
With CNA still trading below some intrinsic value estimates but already past the initial Fed reaction pop, the central question is whether today’s level marks an attractive entry point or whether markets are already pricing in future growth.
Price-to-Earnings of 12.6x: Is it justified?
CNA Financial’s latest close at $46.57 implies a price-to-earnings ratio of 12.6x, a level that screens as undervalued against several benchmarks.
The price-to-earnings, or P E, multiple links today’s share price to the company’s current earnings, a core yardstick for mature, profit generating insurers. For CNA, multiple checks point in the same direction, suggesting investors are paying less per dollar of earnings than both peers and what our models indicate could be reasonable.
CNA is not just inexpensive versus a single yardstick. It appears discounted across the board. The stock trades at 12.6x earnings compared to the US Insurance industry average of 13.5x and a peer average of 13.6x, implying the market is assigning a lower earnings valuation than comparable names. Against our estimated fair P E ratio of 15.9x, the gap is even wider, highlighting potential room for the multiple to move higher if sentiment or results improve.
Explore the SWS fair ratio for CNA Financial
Result: Price-to-earnings of 12.6x (UNDERVALUED)
However, risks remain, including execution missteps in core underwriting or a shift toward softer pricing that caps margins just as investors anticipate multiple expansion.
Find out about the key risks to this CNA Financial narrative.
Another View: What Does DCF Say?
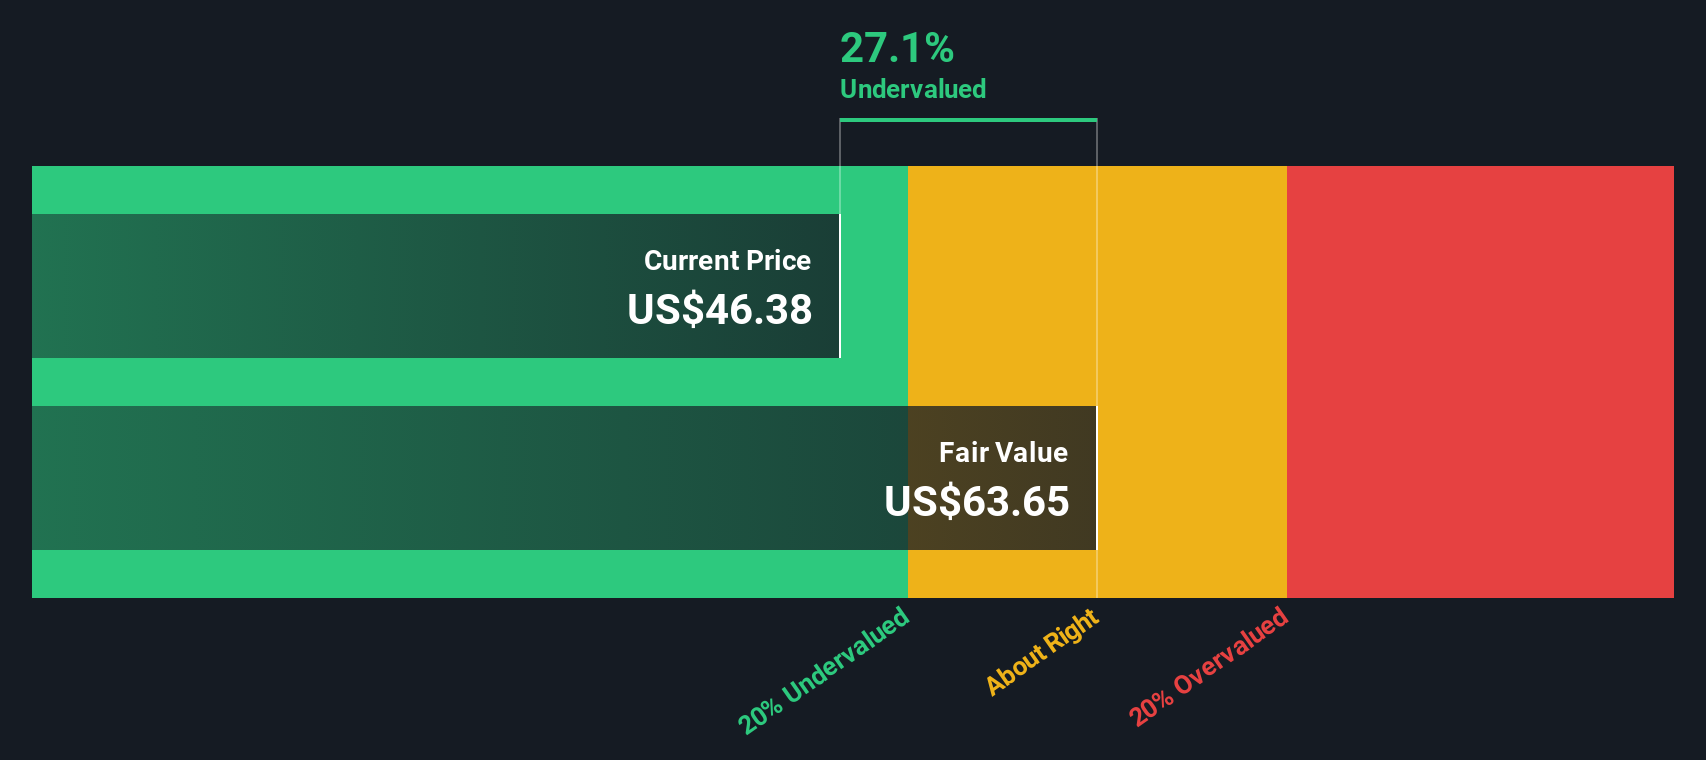
Our DCF model tells a stronger story than the earnings multiple alone, suggesting fair value closer to $63.65, about 27% above the current $46.57 price. If cash flows prove resilient, is the market being too cautious or simply bracing for more volatility?
Look into how the SWS DCF model arrives at its fair value.
Simply Wall St performs a discounted cash flow (DCF) on every stock in the world every day (check out CNA Financial for example). We show the entire calculation in full. You can track the result in your watchlist or portfolio and be alerted when this changes, or use our stock screener to discover 908 undervalued stocks based on their cash flows. If you save a screener we even alert you when new companies match - so you never miss a potential opportunity.
Build Your Own CNA Financial Narrative
If you see things differently or want to dig into the numbers yourself, you can build a personalized view in just minutes: Do it your way.
A great starting point for your CNA Financial research is our analysis highlighting 3 key rewards and 1 important warning sign that could impact your investment decision.
Ready for your next investing move?
Do not stop at a single opportunity. Use the Simply Wall Street Screener to uncover focused sets of stocks that match the way you actually want to invest.
- Capture potential income now by scanning for companies in these 13 dividend stocks with yields > 3% that can strengthen your portfolio’s cash flow.
- Position yourself for structural growth by targeting innovators in these 26 AI penny stocks before their stories become mainstream.
- Lock in a margin of safety by sorting through these 908 undervalued stocks based on cash flows that may be trading below what their cash flows suggest they are worth.
This article by Simply Wall St is general in nature. We provide commentary based on historical data and analyst forecasts only using an unbiased methodology and our articles are not intended to be financial advice. It does not constitute a recommendation to buy or sell any stock, and does not take account of your objectives, or your financial situation. We aim to bring you long-term focused analysis driven by fundamental data. Note that our analysis may not factor in the latest price-sensitive company announcements or qualitative material. Simply Wall St has no position in any stocks mentioned.
Have feedback on this article? Concerned about the content? Get in touch with us directly. Alternatively, email editorial-team@simplywallst.com