
- LIVE QUOTES
- LEARN
- HELP
 Nasdaq
 Wall Street Journal
EN
Has Teva’s 80% One Year Surge Run Ahead of Its Fundamental Valuation in 2025?
- If you are wondering whether Teva Pharmaceutical Industries is still a buy after its big run, you are not alone. This stock has quickly moved from contrarian idea to front and center on many investors watchlists.
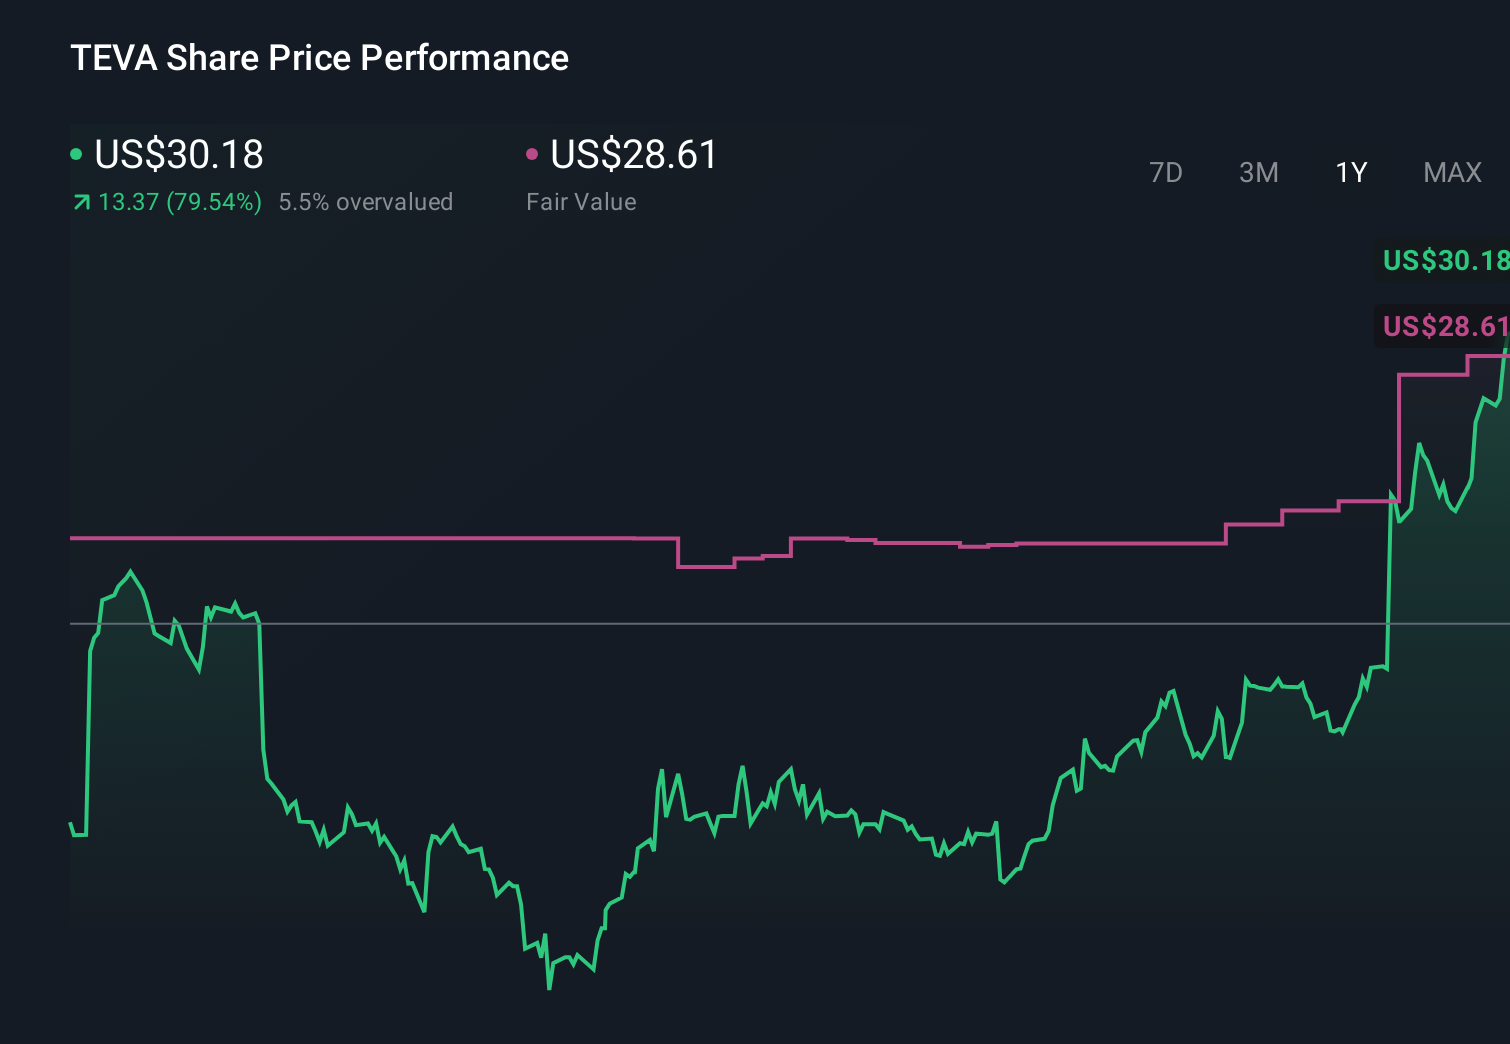
- Over the last week Teva is up 4.7%. It has climbed 17.2% over the past month, and the stock is now sitting on a 39.9% gain year to date and an 80.5% rise over the last year, with a 242.8% return in 3 years and 197.6% over 5 years.
- Much of this momentum reflects a shift in how the market views Teva's turnaround prospects and its progress in managing past legal and balance sheet overhangs. Investors are increasingly treating Teva as a re-rating story in global pharmaceuticals rather than a permanently discounted value trap.
- Despite that optimism, Teva only scores 2 out of 6 on our valuation checks. Next we will unpack what different valuation approaches say about the stock today, and then finish with a more holistic way to think about its worth.
Teva Pharmaceutical Industries scores just 2/6 on our valuation checks. See what other red flags we found in the full valuation breakdown.
Approach 1: Teva Pharmaceutical Industries Discounted Cash Flow (DCF) Analysis
A Discounted Cash Flow, or DCF, model estimates what a company is worth today by projecting its future cash flows and then discounting them back to a present value using a required rate of return. For Teva Pharmaceutical Industries, the model used is a 2 Stage Free Cash Flow to Equity approach, which first relies on analyst forecasts and then extends them with longer term assumptions.
Teva generated trailing twelve month free cash flow of about $542 Million, and analysts expect this to rise over the next decade, with Simply Wall St extrapolating free cash flow to roughly $6.1 Billion by 2035. These projections reflect a business that is expected to convert more of its earnings into cash for shareholders as the turnaround progresses.
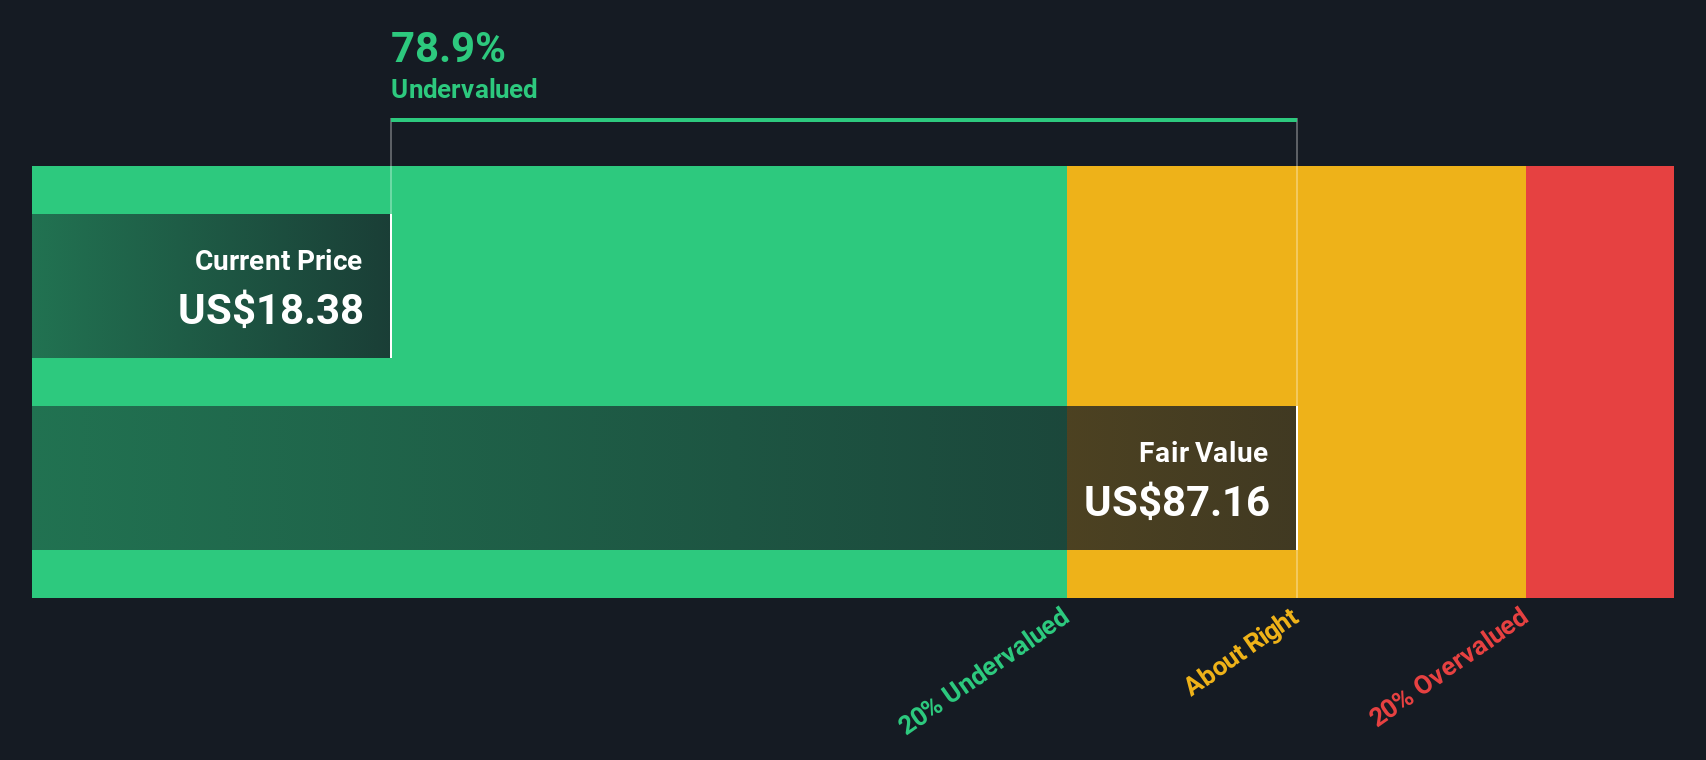
When all those future cash flows are discounted back to today, the DCF model arrives at an intrinsic value of about $72.80 per share. Compared with the current share price, this implies the stock is trading at a 59.1% discount to its estimated fair value.
Result: UNDERVALUED (per this DCF model)
Our Discounted Cash Flow (DCF) analysis suggests Teva Pharmaceutical Industries is undervalued by 59.1%. Track this in your watchlist or portfolio, or discover 908 more undervalued stocks based on cash flows.
Approach 2: Teva Pharmaceutical Industries Price vs Earnings
For profitable companies like Teva Pharmaceutical Industries, the price to earnings, or PE, ratio is a useful way to gauge how much investors are willing to pay for each dollar of current earnings. In general, faster growing and lower risk businesses tend to have higher PE ratios, while slower growing or riskier companies tend to trade on lower multiples.
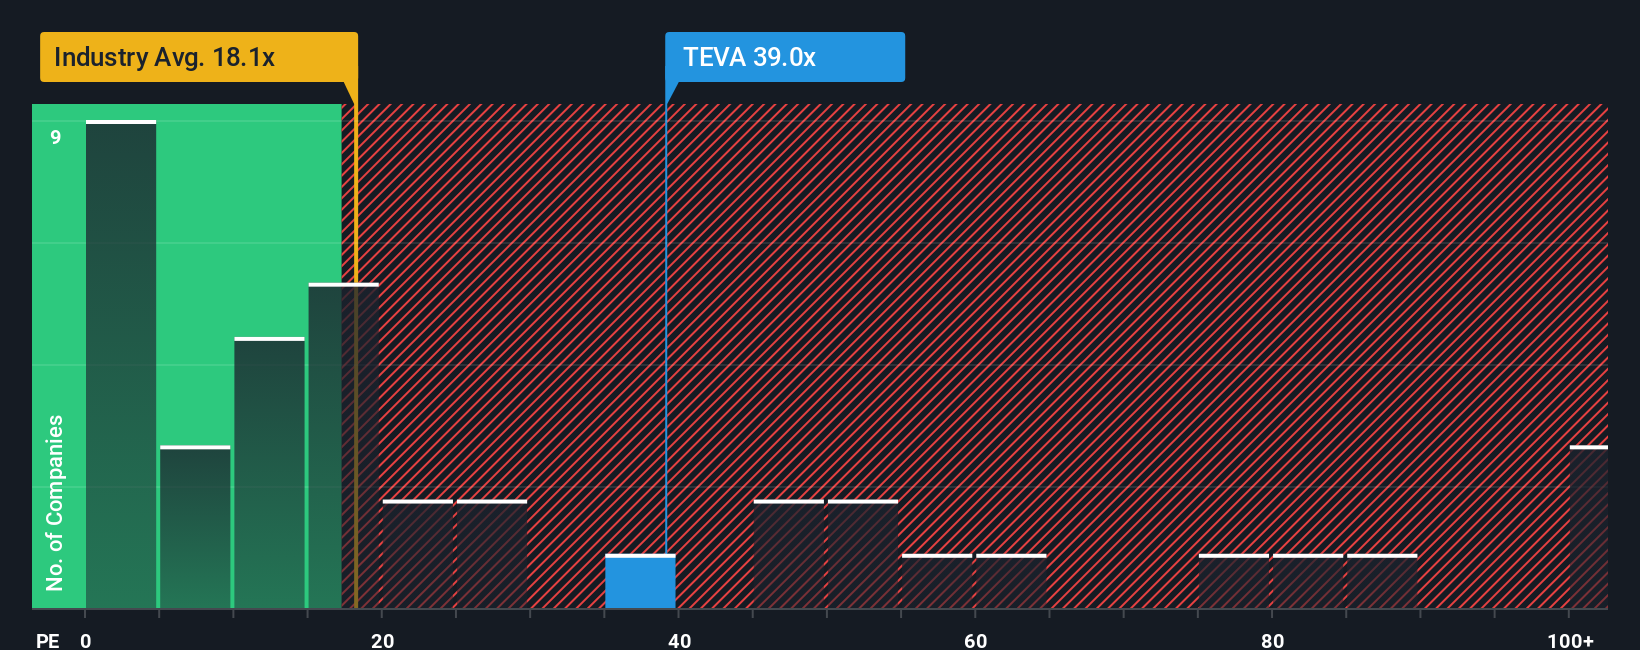
Teva currently trades on a PE of about 47.93x. That is well above the broader Pharmaceuticals industry average of around 19.73x and also higher than the 36.82x average of its peer group. On the surface, that suggests the market is already paying a premium for Teva relative to many competitors, likely reflecting optimism about its turnaround and earnings trajectory.
Simply Wall St also calculates a proprietary Fair Ratio of 29.93x for Teva. This Fair Ratio goes beyond simple peer or industry comparisons by factoring in company specific elements such as expected earnings growth, profit margins, risk profile, industry characteristics and market capitalization. Because it incorporates these fundamentals, it can offer a more tailored view of what multiple Teva arguably deserves. Comparing Teva's current PE of 47.93x with the Fair Ratio of 29.93x indicates the shares look overvalued on this metric.
Result: OVERVALUED
PE ratios tell one story, but what if the real opportunity lies elsewhere? Discover 1444 companies where insiders are betting big on explosive growth.
Upgrade Your Decision Making: Choose your Teva Pharmaceutical Industries Narrative
Earlier we mentioned that there is an even better way to understand valuation, so let us introduce you to Narratives, which are simple, story driven explanations of what you believe will happen to a company, tied directly to your assumptions about its future revenue, earnings, margins and fair value. Instead of stopping at ratios like PE, a Narrative on Simply Wall St connects three things: the company’s business story, a quantified financial forecast, and the fair value that falls out of those numbers. All of this is presented within an easy to use tool on the Community page used by millions of investors. Narratives help you consider whether to buy, hold or sell by constantly comparing your Fair Value to the live share price, and they automatically update as new information, such as earnings reports or major news, flows into the platform. For Teva Pharmaceutical Industries, for example, one investor’s bullish Narrative might lean toward the higher analyst price target of about 29 dollars, assuming strong execution and margin expansion, while a more cautious investor could anchor closer to 18 dollars, highlighting debt, pricing pressure and execution risks. Both perspectives are expressed, tracked and refined through their Narratives.
Do you think there's more to the story for Teva Pharmaceutical Industries? Head over to our Community to see what others are saying!
This article by Simply Wall St is general in nature. We provide commentary based on historical data and analyst forecasts only using an unbiased methodology and our articles are not intended to be financial advice. It does not constitute a recommendation to buy or sell any stock, and does not take account of your objectives, or your financial situation. We aim to bring you long-term focused analysis driven by fundamental data. Note that our analysis may not factor in the latest price-sensitive company announcements or qualitative material. Simply Wall St has no position in any stocks mentioned.
Have feedback on this article? Concerned about the content? Get in touch with us directly. Alternatively, email editorial-team@simplywallst.com