
- LIVE QUOTES
- LEARN
- HELP
 Nasdaq
 Wall Street Journal
EN
Peloton Interactive Valuation After 95% Slide and Turnaround Efforts in Connected Fitness
- If you are wondering whether Peloton Interactive at around $6.54 is a beaten down bargain or a value trap, you are not alone. That is exactly what we are going to unpack here.
- Despite a brutal longer term ride, with the stock down about 95.3% over 5 years and 31.7% over the last year, it has shown some near term resilience. It edged up 1.9% in the past week, even after a 12.6% slide over the last month and a 25.9% drop year to date.
- Recent headlines have focused on Peloton's ongoing turnaround efforts, including product strategy tweaks, partnerships and cost cutting initiatives that aim to stabilize the business and rebuild investor confidence. At the same time, market sentiment around connected fitness, competition and consumer spending patterns continues to shape how investors interpret every piece of Peloton related news.
- Right now Peloton only scores a 2/6 valuation check score, suggesting the market is still cautious, but headline numbers do not tell the whole story. Next we will walk through different valuation approaches to see what they imply for Peloton, and then wrap up with a more intuitive way to think about what the stock might really be worth.
Peloton Interactive scores just 2/6 on our valuation checks. See what other red flags we found in the full valuation breakdown.
Approach 1: Peloton Interactive Discounted Cash Flow (DCF) Analysis
A Discounted Cash Flow model estimates what a company is worth by projecting its future cash flows and then discounting those back to today in dollar terms. For Peloton Interactive, the model uses a two stage Free Cash Flow to Equity approach, starting from last twelve month free cash flow of about $370 million and building forward.
Analysts provide detailed estimates for the next several years, which are then extended by Simply Wall St to map out a longer runway. In this case, free cash flow is projected to rise to around $480.6 million by 2030, based on assumptions of steady growth from today as the turnaround takes hold and margins improve.
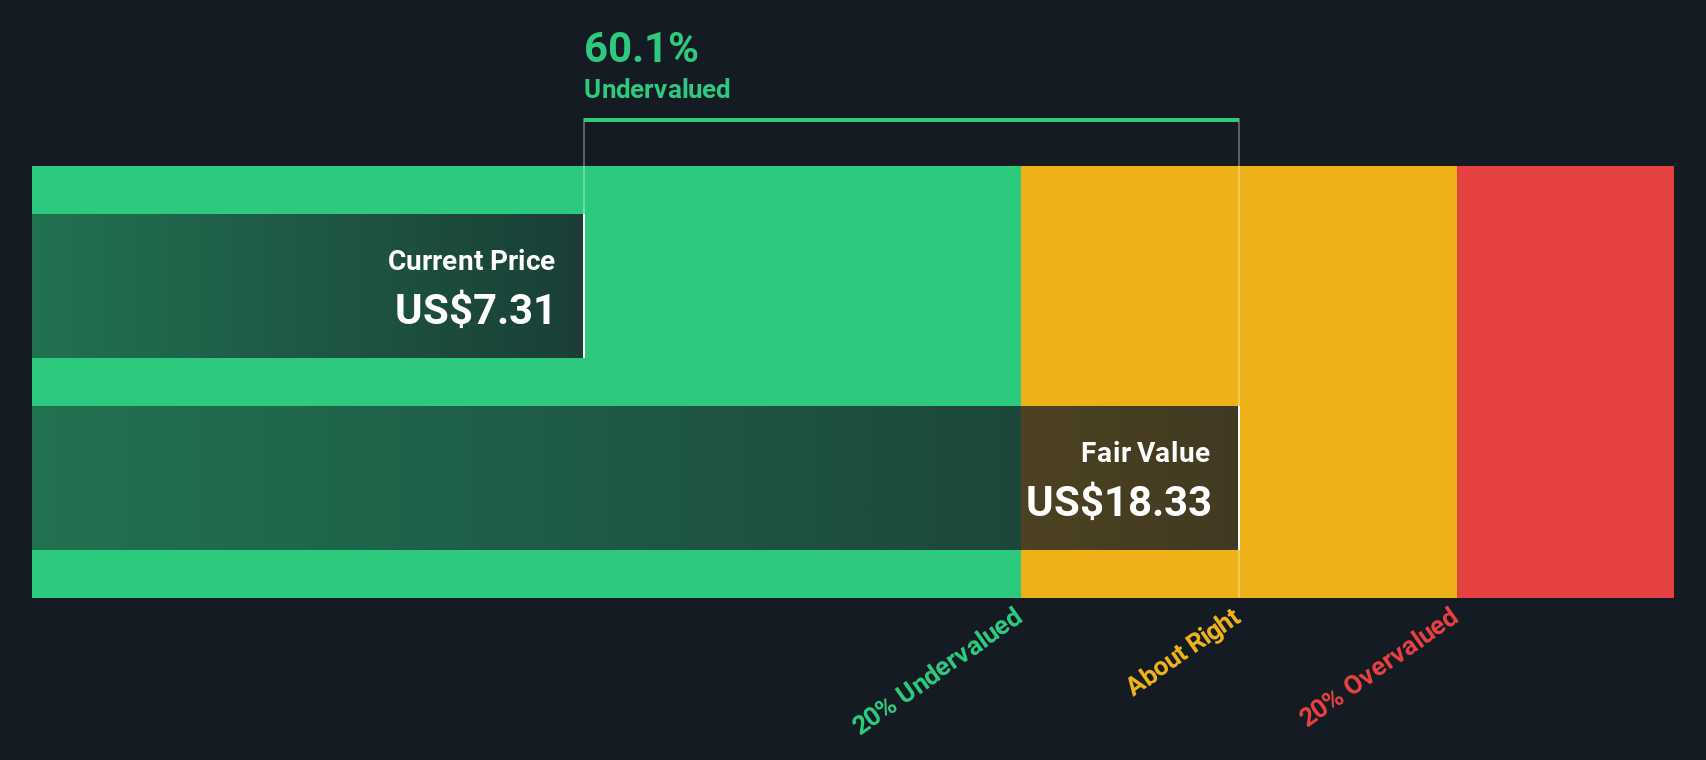
When those future cash flows are discounted back to the present, the DCF in this example points to an estimated intrinsic value of about $19.69 per share. Versus a current share price near $6.54, the model implies roughly a 66.8% discount, which suggests the market may be pricing in a more pessimistic scenario than these cash flow projections assume.
Result: UNDERVALUED (per this DCF model)
Our Discounted Cash Flow (DCF) analysis suggests Peloton Interactive is undervalued by 66.8%. Track this in your watchlist or portfolio, or discover 908 more undervalued stocks based on cash flows.
Approach 2: Peloton Interactive Price vs Sales
For companies like Peloton that are not consistently profitable, the price to sales ratio is often a more reliable yardstick than earnings based measures. It focuses on how much investors are paying for each dollar of revenue, which tends to be more stable than earnings during turbulent turnaround phases.
What investors consider a normal or fair sales multiple depends on how quickly revenue is expected to grow and how risky that growth looks. Faster, more predictable growth can justify a higher multiple, while slower or uncertain growth usually pulls the multiple down.
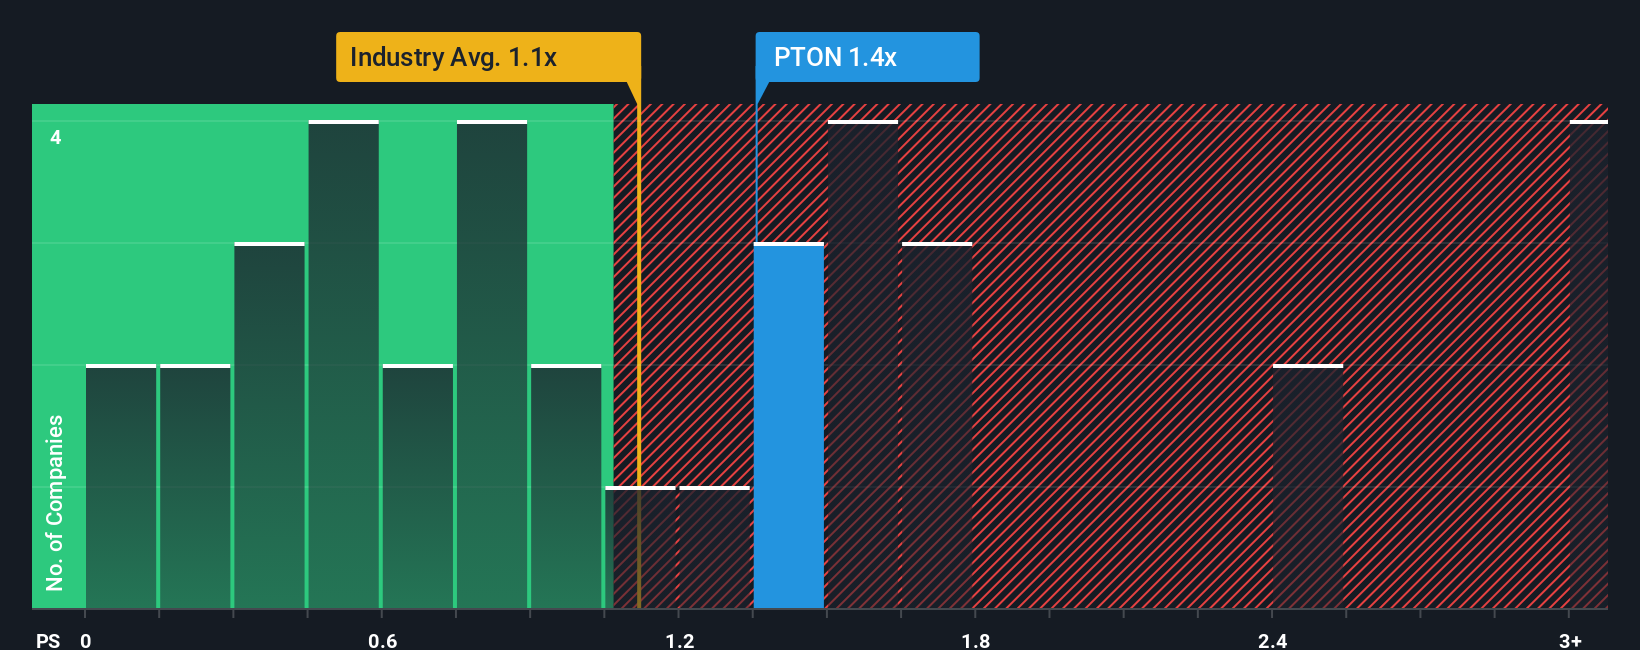
Peloton currently trades at about 1.11x sales, which is a bit richer than both the Leisure industry average of around 0.95x and the peer group average near 0.96x. Simply Wall St’s Fair Ratio, at roughly 1.04x, blends in factors such as Peloton’s growth outlook, margins, risk profile, market cap and industry positioning to estimate what a more tailored multiple should be.
This Fair Ratio is more informative than a simple peer or industry comparison because it adjusts for Peloton’s specific strengths and challenges rather than assuming it should look like the average company. With the current 1.11x sales only modestly above the 1.04x Fair Ratio, Peloton looks slightly expensive on this metric, but not dramatically so.
Result: ABOUT RIGHT
PS ratios tell one story, but what if the real opportunity lies elsewhere? Discover 1444 companies where insiders are betting big on explosive growth.
Upgrade Your Decision Making: Choose your Peloton Interactive Narrative
Earlier we mentioned that there is an even better way to understand valuation, so let us introduce you to Narratives, a simple way to connect your view of Peloton Interactive’s story to a set of numbers like future revenue, earnings, margins and a fair value estimate, then see how that stacks up against today’s share price. On Simply Wall St’s Community page, Narratives turn your perspective into a dynamic forecast that links Peloton’s strategy, risks and opportunities to concrete financial outcomes, helping you quickly judge whether the stock appears worth buying, holding or selling whenever its fair value diverges from the market price. Because Narratives on the platform are updated as new news, earnings and guidance arrive, your view stays current without you having to rebuild every model from scratch. For example, some investors in the community currently think Peloton is worth closer to $20 per share if its product overhaul, AI features and wellness expansion gain real traction, while more cautious investors see fair value nearer $5 if subscriber growth disappoints and competition eats into pricing power, and Narratives make those differences transparent so you can assess which story aligns more closely with your own view.
Do you think there's more to the story for Peloton Interactive? Head over to our Community to see what others are saying!

This article by Simply Wall St is general in nature. We provide commentary based on historical data and analyst forecasts only using an unbiased methodology and our articles are not intended to be financial advice. It does not constitute a recommendation to buy or sell any stock, and does not take account of your objectives, or your financial situation. We aim to bring you long-term focused analysis driven by fundamental data. Note that our analysis may not factor in the latest price-sensitive company announcements or qualitative material. Simply Wall St has no position in any stocks mentioned.
Have feedback on this article? Concerned about the content? Get in touch with us directly. Alternatively, email editorial-team@simplywallst.com