
- LIVE QUOTES
- LEARN
- HELP
 Nasdaq
 Wall Street Journal
EN
Is EMCOR Group Still Attractive After Its 607% Five Year Share Price Surge?
- If you have been wondering whether EMCOR Group is still worth buying after its huge run, you are not alone. This is exactly the kind of stock where valuation really starts to matter.
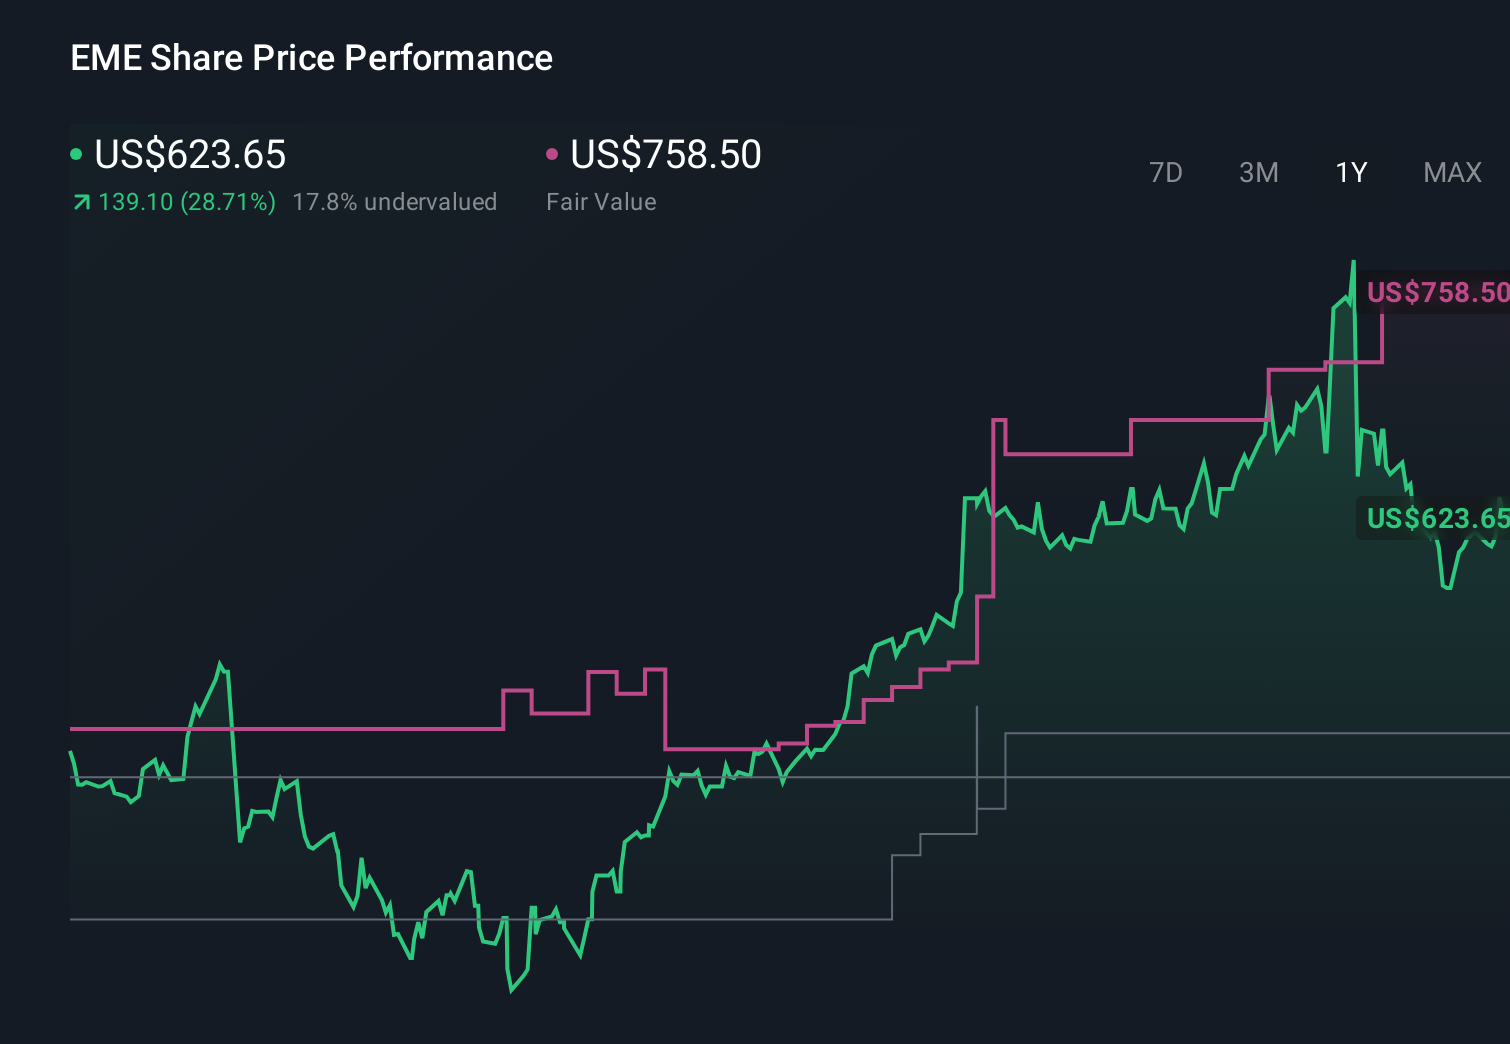
- The share price now sits around $623.65 after climbing 36.3% year to date and 607.6% over the last 5 years, which naturally raises questions about how much upside is left versus the risk of a pullback.
- Recently, investors have been focusing on EMCOR's role in large scale infrastructure, data center, and specialized mechanical and electrical projects in the US, as those long dated contracts can drive more predictable cash flows. At the same time, coverage has highlighted how the company is leaning into demand for energy efficiency and mission critical facility upgrades, helping explain why the market has been willing to pay up for the stock.
- Despite that big move, EMCOR currently scores a perfect 6/6 on our valuation checks, suggesting it still screens as undervalued across multiple methods. Next we will unpack those models, then finish with a more nuanced way to think about what fair value really means for this business.
Find out why EMCOR Group's 30.4% return over the last year is lagging behind its peers.
Approach 1: EMCOR Group Discounted Cash Flow (DCF) Analysis
A Discounted Cash Flow model estimates what a business is worth by projecting the cash it can generate in the future and then discounting those cash flows back to today in dollar terms. For EMCOR Group, the 2 Stage Free Cash Flow to Equity model starts with last twelve month free cash flow of about $1.15 billion and builds in analyst forecasts for the next few years, then extrapolates further growth beyond that.
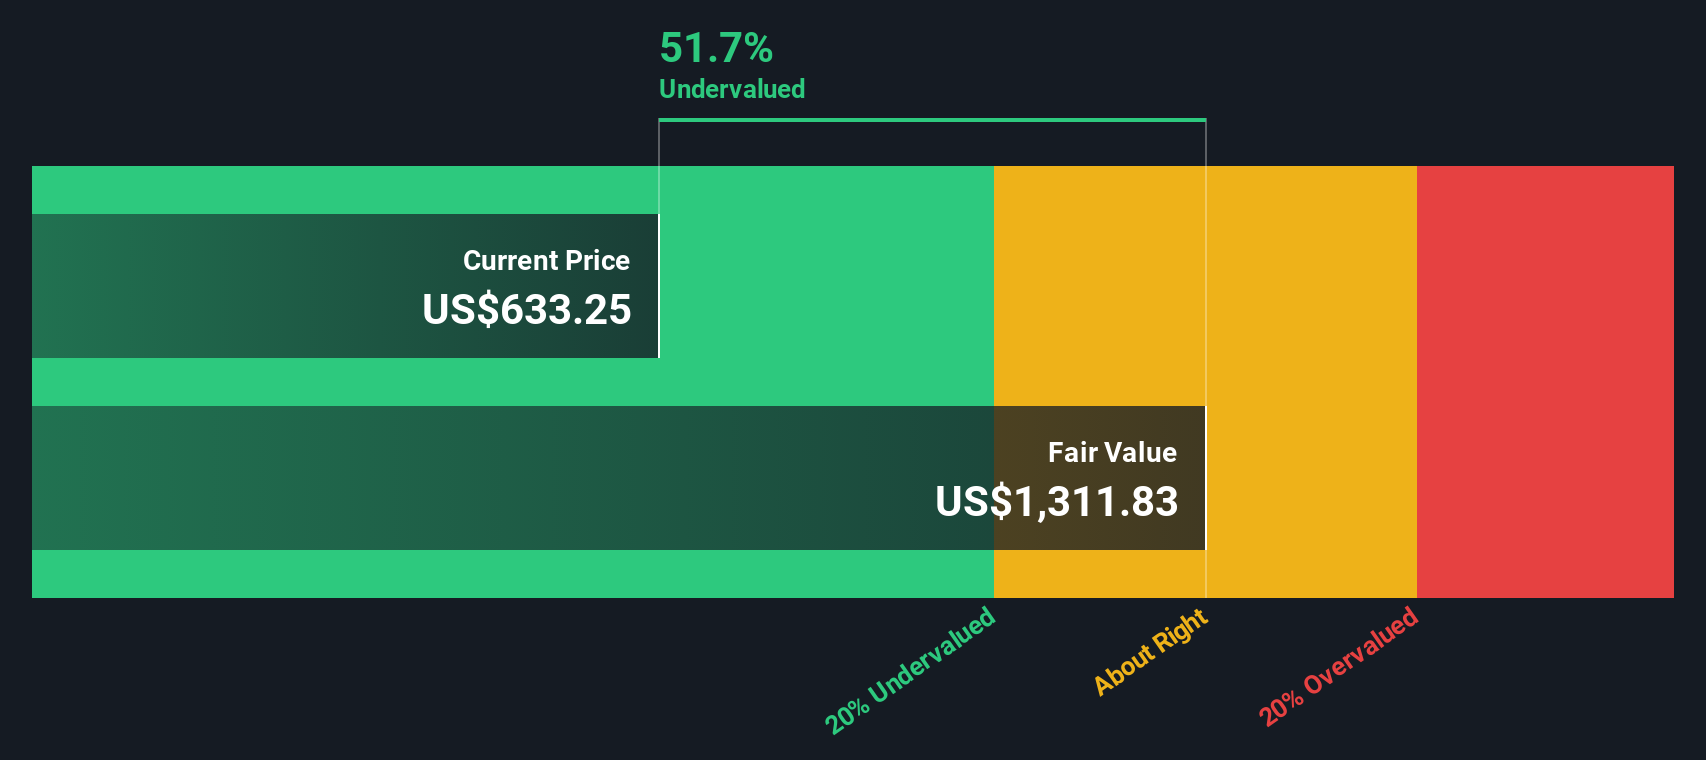
On this basis, EMCOR's free cash flow is projected to rise to roughly $3.03 billion by 2035, with growth gradually slowing over time as the business matures. Those future cash flows are then discounted back to their present value, which results in an estimated intrinsic value of about $909.54 per share.
Compared with the current share price of around $623.65, the DCF implies the stock is trading at roughly a 31.4% discount to its calculated fair value. This indicates potential upside if these cash flow assumptions prove accurate.
Result: UNDERVALUED
Our Discounted Cash Flow (DCF) analysis suggests EMCOR Group is undervalued by 31.4%. Track this in your watchlist or portfolio, or discover 904 more undervalued stocks based on cash flows.
Approach 2: EMCOR Group Price vs Earnings
For a consistently profitable business like EMCOR, the price to earnings multiple is a useful yardstick because it links what investors pay directly to the company’s current earnings power. In general, faster growing and lower risk companies deserve higher PE ratios. Slower or more volatile businesses typically trade on lower multiples to compensate for uncertainty.
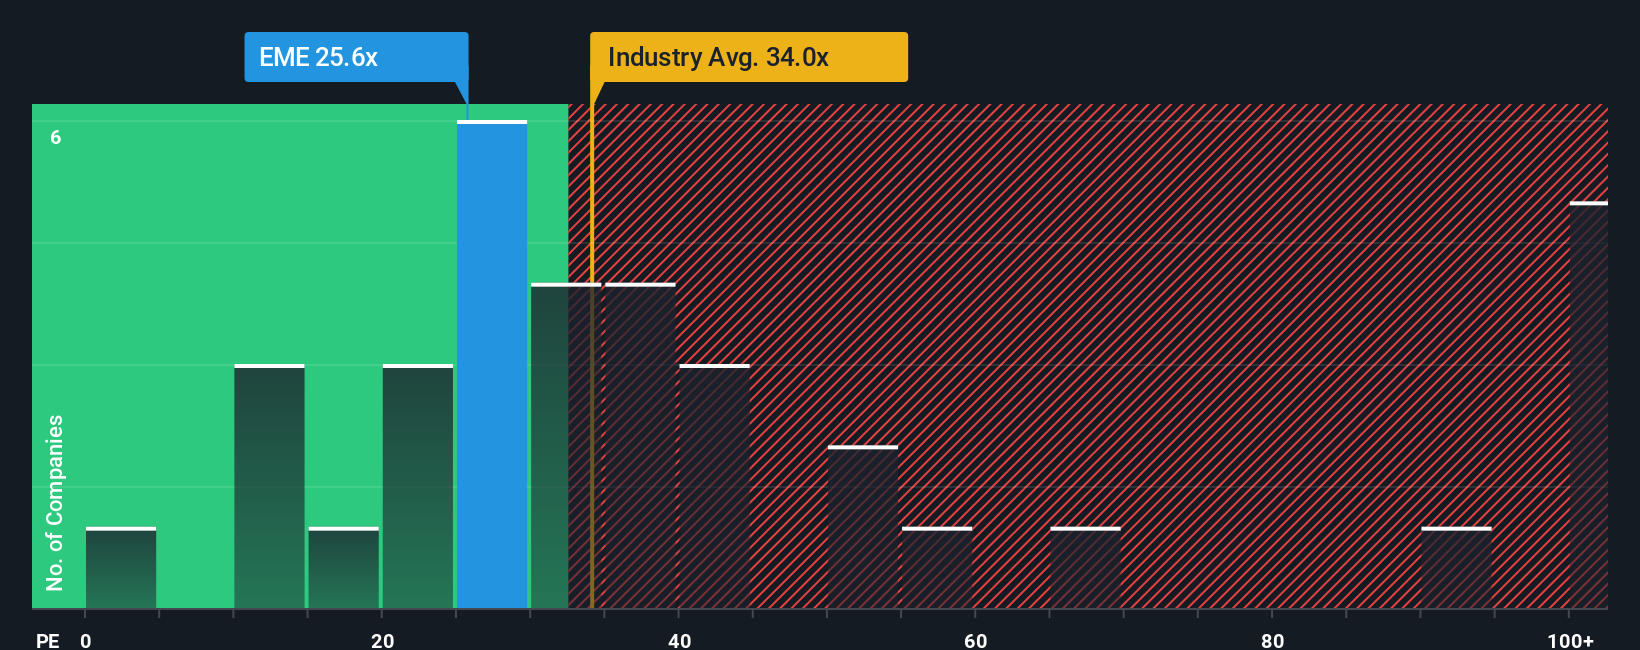
EMCOR currently trades on a PE of about 24.7x, which is below both the US Construction industry average of roughly 32.3x and the broader peer group average near 54.7x. That discount might look attractive on the surface, but it does not fully account for EMCOR’s specific growth profile, profitability, and risk.
Simply Wall St’s Fair Ratio framework tackles this by estimating what PE the market should reasonably assign to EMCOR given its earnings growth, margins, industry, market cap, and risk characteristics. For EMCOR, that Fair Ratio sits around 29.4x, implying the market is valuing the shares at a lower multiple than would be expected based on those fundamentals. On that basis, the stock still screens as undervalued on earnings.
Result: UNDERVALUED
PE ratios tell one story, but what if the real opportunity lies elsewhere? Discover 1444 companies where insiders are betting big on explosive growth.
Upgrade Your Decision Making: Choose your EMCOR Group Narrative
Earlier we mentioned that there is an even better way to understand valuation, so let us introduce you to Narratives, a simple tool on Simply Wall St’s Community page that lets you attach a clear story about EMCOR Group to your assumptions for future revenue, earnings, margins, and fair value, then continuously tracks whether that story still makes sense as new news and earnings arrive.
Instead of only relying on static models, a Narrative connects three things: the business story you believe, the financial forecast that follows from it, and the fair value those numbers imply. This means you can quickly compare that fair value to today’s price and decide if EMCOR looks like a buy, hold, or sell under your view.
Because Narratives live on the platform used by millions of investors, you can see how different perspectives translate into different values. For example, one EMCOR Narrative might assume a fair value near $468.79 based on more moderate growth and margins, while another might land closer to $758.50 using stronger assumptions and a higher multiple, giving you a practical range to stress test your own outlook.
For EMCOR Group however we will make it really easy for you with previews of two leading EMCOR Group Narratives:
Fair value: $758.50 per share
Implied undervaluation versus $623.65: approximately 17.8%
Revenue growth assumption: 8.28% per year
- Backlog growth, reshoring projects, and sustainability driven retrofits are expected to support multiyear revenue growth and gradually higher margins.
- Raised 2025 guidance, disciplined acquisitions like Miller Electric, and investment in talent and prefabrication are seen as strengthening EMCOR’s competitive position despite labor constraints.
- Analysts describe the stock as close to fairly priced today, but still capable of compounding earnings and justifying a premium multiple if execution on complex projects and M&A integrations remains solid.
Fair value: $468.79 per share
Implied overvaluation versus $623.65: approximately 33.1%
Revenue growth assumption: 9.0% per year
- While the narrative acknowledges strong structural drivers, including infrastructure, data centers, electrification, and reshoring, it assumes more moderate long run profitability and valuation multiples.
- Key risks center on economic cyclicality, labor shortages, cost inflation, supply chain disruptions, and heavy exposure to government and large project spending.
- On these assumptions, EMCOR screens as materially overvalued at current levels, indicating that investors might consider requiring a lower entry price to compensate for execution and macroeconomic risks.
Do you think there's more to the story for EMCOR Group? Head over to our Community to see what others are saying!
This article by Simply Wall St is general in nature. We provide commentary based on historical data and analyst forecasts only using an unbiased methodology and our articles are not intended to be financial advice. It does not constitute a recommendation to buy or sell any stock, and does not take account of your objectives, or your financial situation. We aim to bring you long-term focused analysis driven by fundamental data. Note that our analysis may not factor in the latest price-sensitive company announcements or qualitative material. Simply Wall St has no position in any stocks mentioned.
Have feedback on this article? Concerned about the content? Get in touch with us directly. Alternatively, email editorial-team@simplywallst.com