
- LIVE QUOTES
- LEARN
- HELP
 Nasdaq
 Wall Street Journal
EN
Has GameStop’s Meme Legacy Left the Stock Mispriced After Its 30% Slide in 2025?
- If you are wondering whether GameStop is still a bargain or just a meme-era relic, you are not alone. This article unpacks what the current price really implies about its value.
- Despite a wild 5 year total return of roughly 450%, GameStop now trades around $21.23, with the stock down 7.7% over the last week and 30.8% year to date, while still slightly positive over 3 years.
- Recently, GameStop has stayed in the spotlight as traders continue to debate the companys long term business transformation and the durability of meme driven interest. Headlines around short interest, retail investor activity on social platforms, and speculation about strategic shifts have all helped keep volatility elevated, even when fundamentals move more slowly.
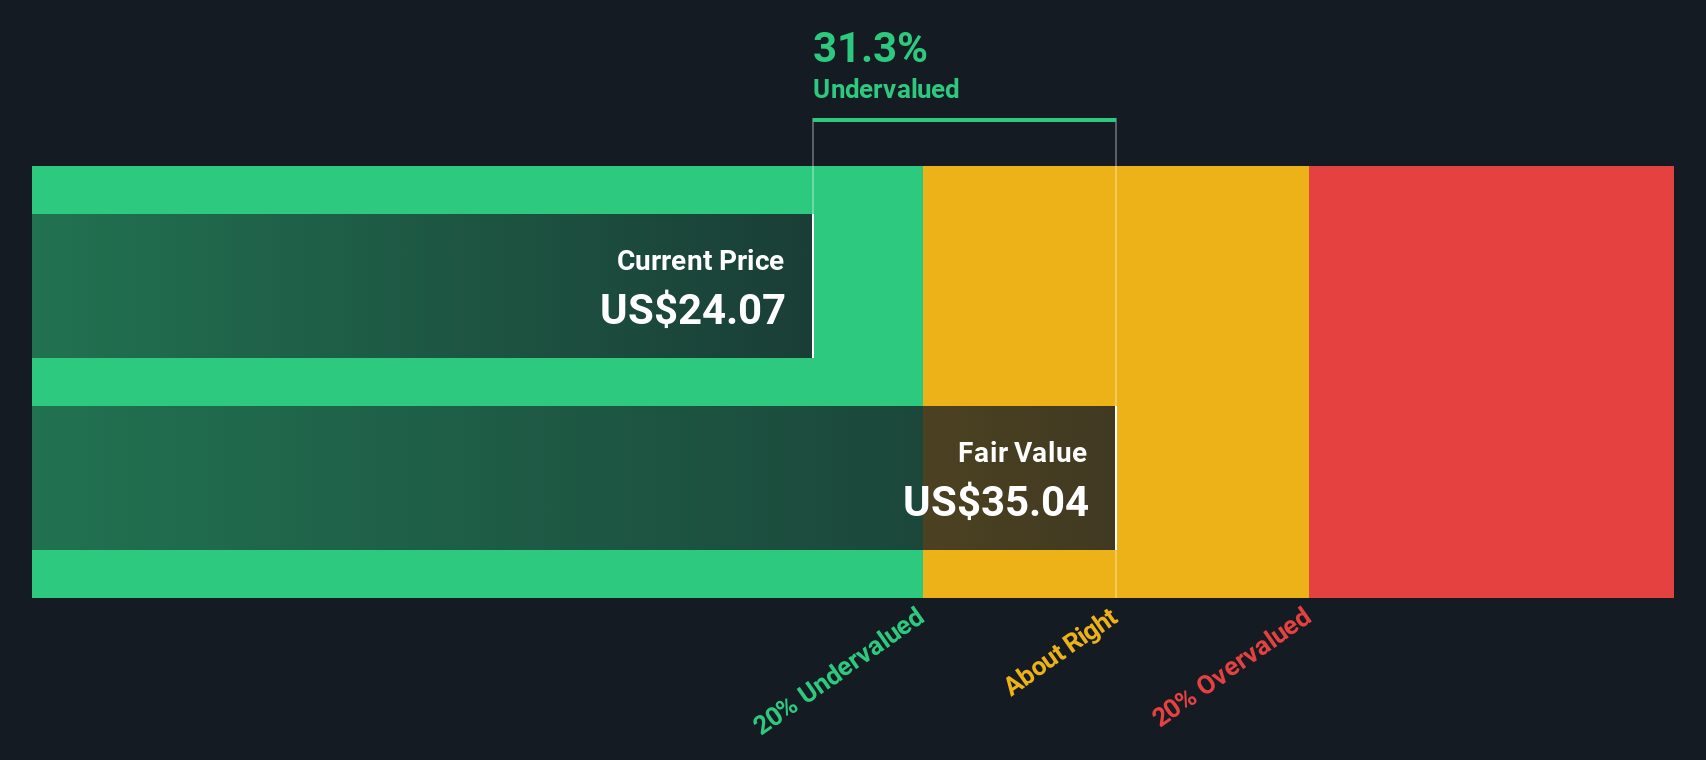
- Right now, GameStop scores just 2/6 on our valuation checks. It only looks undervalued on a couple of metrics. We will walk through those traditional valuation approaches next and then point to a more complete way of thinking about value by the end of this article.
GameStop scores just 2/6 on our valuation checks. See what other red flags we found in the full valuation breakdown.
Approach 1: GameStop Discounted Cash Flow (DCF) Analysis
A Discounted Cash Flow model estimates what a company is worth by projecting the cash it could generate in the future and then discounting those cash flows back to today, using a required rate of return.
For GameStop, the latest twelve month Free Cash Flow is about $563.2 million. Using a 2 Stage Free Cash Flow to Equity model, analysts and Simply Wall St first estimate cash flows for the next few years, then extrapolate further long term. In this case, projected Free Cash Flow rises to roughly $4.5 billion by 2035, with growth initially steep and then slowing as the business matures.
When all of those future cash flows are discounted back to today, the DCF model suggests an intrinsic value of about $100.36 per share. Compared with a recent market price around $21, the model implies GameStop is trading at roughly a 78.8% discount to its estimated fair value, which points to the stock being significantly undervalued on these cash flow assumptions.
Result: UNDERVALUED
Our Discounted Cash Flow (DCF) analysis suggests GameStop is undervalued by 78.8%. Track this in your watchlist or portfolio, or discover 903 more undervalued stocks based on cash flows.
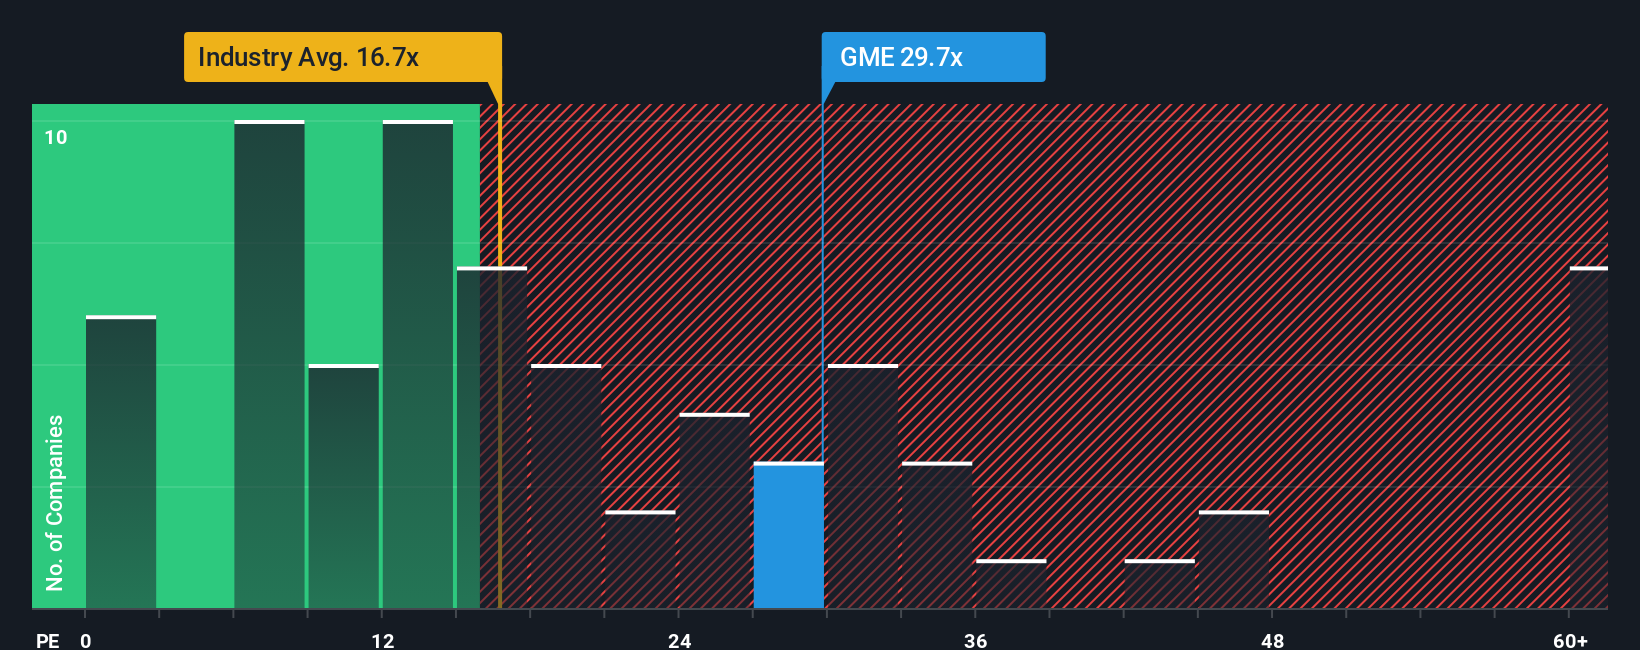
Approach 2: GameStop Price vs Earnings
For a company that is generating profits, the price to earnings ratio is often the most intuitive way to think about value, because it links what investors pay today to the earnings the business is already producing. In general, faster and more reliable earnings growth, and lower perceived risk, justify a higher normal or fair PE ratio, while slower growth or higher uncertainty usually deserve a lower multiple.
GameStop currently trades on a PE of about 22.5x, which sits slightly above the Specialty Retail industry average of roughly 20.2x and close to peer levels around 20.4x. Simply Wall St also calculates a proprietary Fair Ratio, which is the PE you would expect for GameStop once you factor in its specific earnings growth outlook, profit margins, market cap, industry positioning and risk profile. This Fair Ratio is more informative than a simple comparison with peers or the broad industry, because it adjusts for the company’s own fundamentals rather than assuming one size fits all.
On this Fair Ratio basis, GameStop’s current 22.5x multiple appears close to its warranted level, suggesting the market is roughly pricing in the company’s prospects and risks.
Result: ABOUT RIGHT
PE ratios tell one story, but what if the real opportunity lies elsewhere? Discover 1443 companies where insiders are betting big on explosive growth.
Upgrade Your Decision Making: Choose your GameStop Narrative
Earlier we mentioned that there is an even better way to understand valuation, so let us introduce you to Narratives, a smarter way to connect the story you believe about a company with the numbers behind its value. A Narrative is simply your view of GameStop’s future, translated into assumptions about revenue, earnings and margins, which then flow into a forecast and a fair value estimate. On Simply Wall St, within the Community page used by millions of investors, Narratives make this process accessible by guiding you from story, to forecast, to fair value, and then helping you compare that fair value to the current share price so you can decide whether it is a buy, hold or sell for you. Narratives also update dynamically when new information, such as earnings or major news, comes in, so your view of fair value stays current instead of going stale. For example, one community Narrative for GameStop currently sees fair value near $120 per share while another puts it closer to $12, reflecting just how differently investors can interpret the same business.
For GameStop, here are previews of two leading GameStop narratives:
Fair value: $120.00 per share
Implied undervaluation vs last close: around 82%
Assumed long term revenue growth: 0%
- Highlights a sharp swing back to profitability and strong Q1 2025 results, including a material earnings beat and positive net income.
- Emphasizes a fortress balance sheet with billions in cash, no long term debt, Bitcoin holdings and aggressive cost cutting under Ryan Cohen.
- Argues that a loyal retail shareholder base, heavy DRS usage and insider buying could limit short selling and support a long runway for value creation.
Fair value: $11.91 per share
Implied overvaluation vs last close: around 44%
Assumed long term revenue growth: 0%
- Notes that while cost cuts have briefly restored profitability, revenues are still falling and the core brick and mortar business faces structural digital headwinds.
- Views crypto exposure and BNPL initiatives as experimental, adding uncertainty without clearly solving the long term business model challenge.
- Warns that meme driven trading, renewed Roaring Kitty attention and high volatility make the stock risky for long term investors whose focus is fundamentals rather than speculation.
Do you think there's more to the story for GameStop? Head over to our Community to see what others are saying!

This article by Simply Wall St is general in nature. We provide commentary based on historical data and analyst forecasts only using an unbiased methodology and our articles are not intended to be financial advice. It does not constitute a recommendation to buy or sell any stock, and does not take account of your objectives, or your financial situation. We aim to bring you long-term focused analysis driven by fundamental data. Note that our analysis may not factor in the latest price-sensitive company announcements or qualitative material. Simply Wall St has no position in any stocks mentioned.
Have feedback on this article? Concerned about the content? Get in touch with us directly. Alternatively, email editorial-team@simplywallst.com