
- LIVE QUOTES
- LEARN
- HELP
 Nasdaq
 Wall Street Journal
EN
Does VICI Properties Share Price Reflect Its Casino Empire And Long Term Lease Growth?
- Wondering if VICI Properties is quietly becoming a bargain, or if the market is correctly pricing its casino and entertainment empire today?
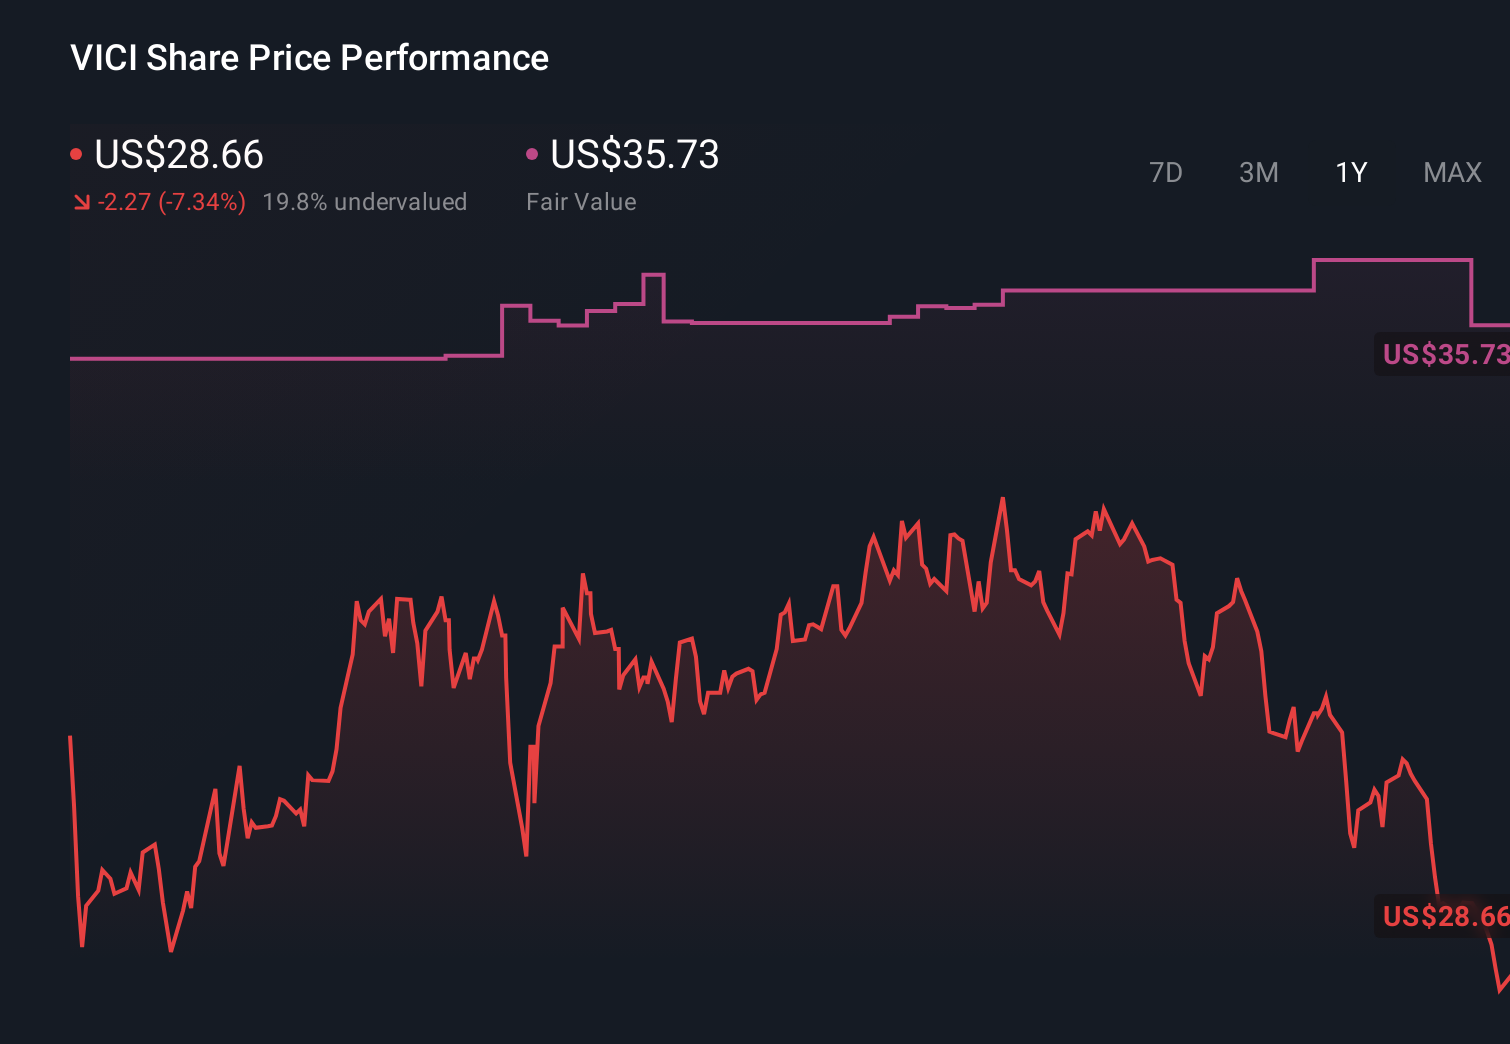
- Even though the stock is up about 3.4% over the last week, it is still roughly flat year to date at around $28.66 and only modestly positive over three years. That makes its 43.8% gain over five years look like a distant memory.
- Recent headlines have focused on VICI's continued role as a major landlord on the Las Vegas Strip and its steady deal making in experiential real estate, reinforcing the idea that its tenants are locked into long term, inflation linked leases. At the same time, shifting views on interest rates and income focused REITs have kept investors debating whether those stable cash flows deserve a richer multiple or a continued discount.
- On our framework, VICI scores a 6/6 valuation score, suggesting it screens as undervalued across all our checks. Next we will unpack what that means under different valuation approaches, before finishing with an even more practical way to think about what the market might be missing.
Approach 1: VICI Properties Discounted Cash Flow (DCF) Analysis
A DCF model estimates what a business is worth today by projecting its future adjusted funds from operations and discounting those cash flows back to their value in $ today.
For VICI Properties, the latest twelve month free cash flow is about $2.37 billion. Analyst estimates and our extrapolations suggest this could rise to roughly $3.97 billion by 2035, with intermediate years like 2028 projected at around $2.98 billion. Near term forecasts come from analysts, while the later years are extrapolated by Simply Wall St using more modest growth assumptions as the business matures.
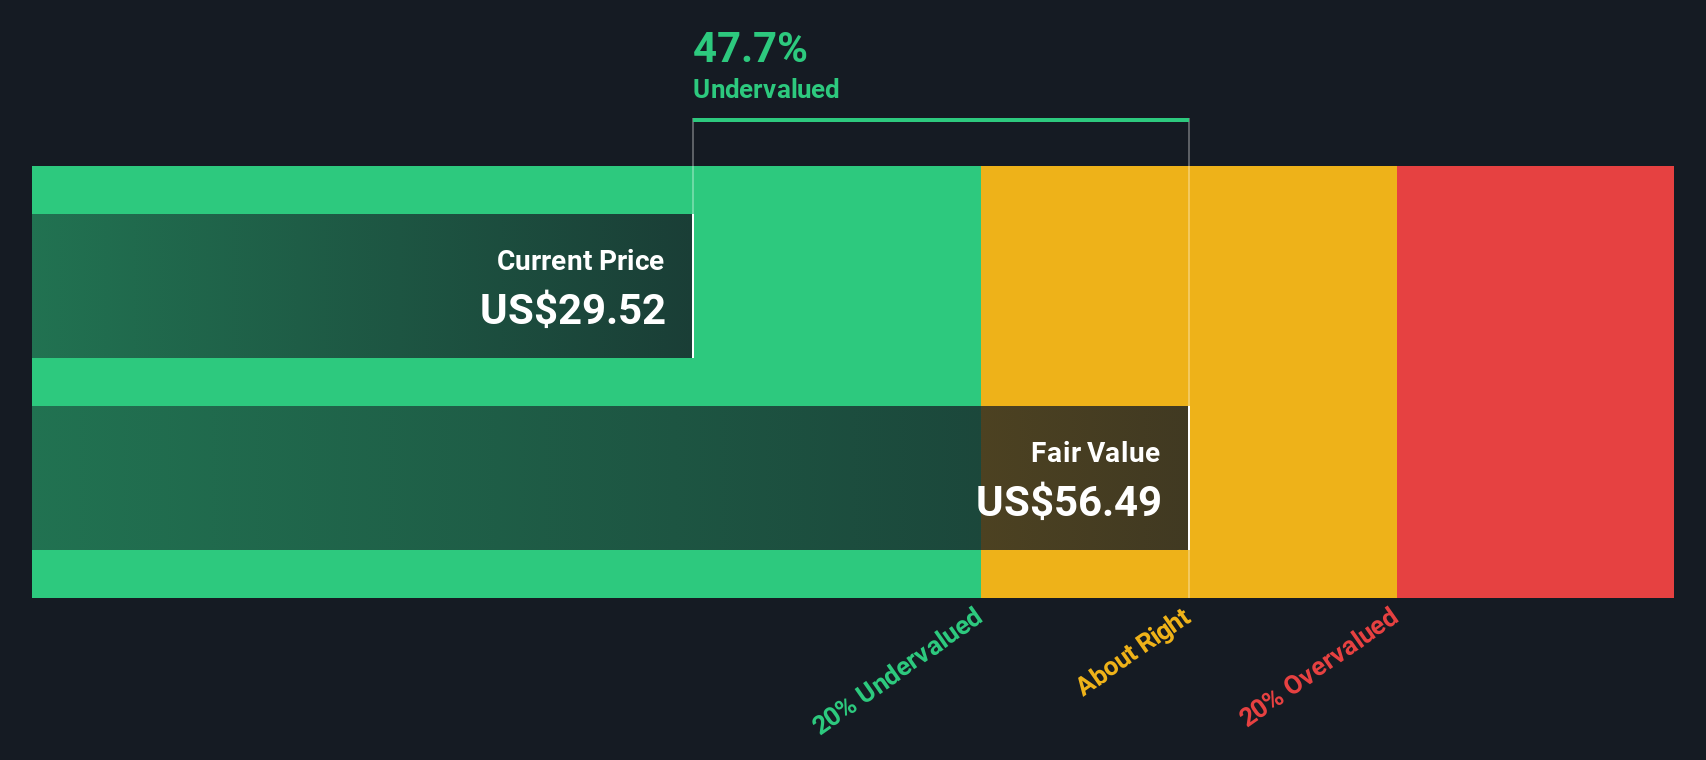
When we aggregate and discount these projected cash flows under a two stage model, we arrive at an estimated intrinsic value of about $54.80 per share. Against the recent share price of roughly $28.66, this comparison suggests VICI may be trading at about a 47.7% discount to its DCF based value, indicating the market is pricing its future cash flows quite conservatively.
Result: UNDERVALUED
Our Discounted Cash Flow (DCF) analysis suggests VICI Properties is undervalued by 47.7%. Track this in your watchlist or portfolio, or discover 903 more undervalued stocks based on cash flows.
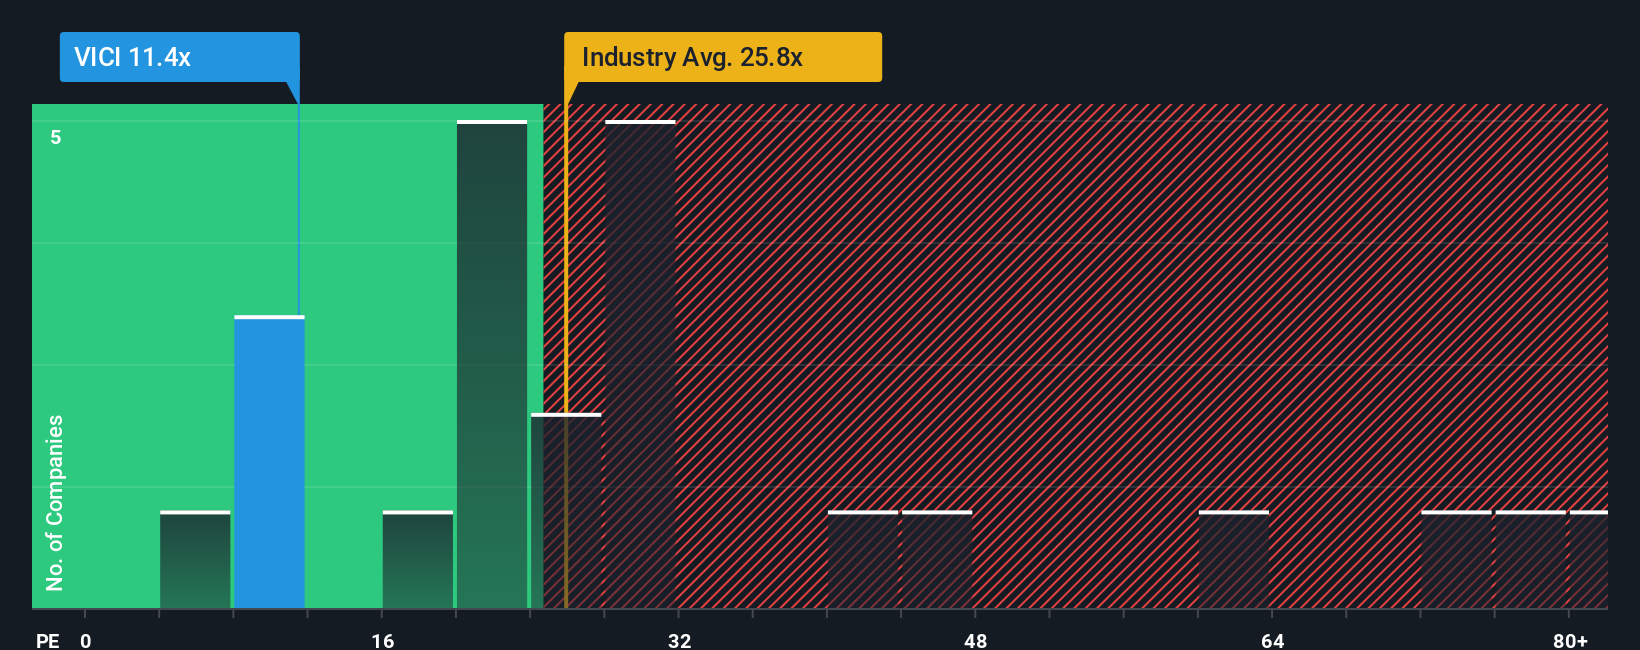
Approach 2: VICI Properties Price vs Earnings
For profitable companies like VICI Properties, the price to earnings ratio is a useful way to gauge how much investors are willing to pay for each dollar of current profit. A higher PE ratio typically reflects stronger growth expectations or lower perceived risk, while a lower PE can point to slower growth, higher risk, or a potential bargain if the business outlook is solid.
VICI currently trades on a PE of about 11x, which is well below the Specialized REITs industry average of roughly 16.6x and significantly under the broader peer group average of around 55.6x. To move beyond simple comparisons, Simply Wall St uses a Fair Ratio, which estimates what VICI’s PE should be given its earnings growth outlook, profit margins, risk profile, industry and market cap. For VICI, this Fair Ratio is about 31.6x, suggesting the stock would warrant a materially higher multiple than today’s market price implies. Because this framework adjusts for company specific factors rather than relying only on blunt industry or peer averages, it provides a more tailored view of valuation. On this basis, VICI appears attractively priced.
Result: UNDERVALUED
PE ratios tell one story, but what if the real opportunity lies elsewhere? Discover 1443 companies where insiders are betting big on explosive growth.
Upgrade Your Decision Making: Choose your VICI Properties Narrative
Earlier we mentioned that there is an even better way to understand valuation, so let us introduce you to Narratives, a simple tool on Simply Wall St’s Community page that lets you connect your story about a company with the numbers behind it. It does this by turning your assumptions about VICI’s future revenue, earnings, and margins into a financial forecast, then a fair value, and finally a clear buy or sell view by comparing that fair value to today’s price. As new news or earnings arrive, Narratives update dynamically. One investor might build a bullish VICI Narrative around resilient experiential demand and a fair value near the upper 40s. Another, more cautious investor might focus on regional gaming and tenant risks and arrive at a fair value closer to the low 30s. Both can quickly see whether their story suggests VICI is undervalued or overvalued at its current market price.
Do you think there's more to the story for VICI Properties? Head over to our Community to see what others are saying!
This article by Simply Wall St is general in nature. We provide commentary based on historical data and analyst forecasts only using an unbiased methodology and our articles are not intended to be financial advice. It does not constitute a recommendation to buy or sell any stock, and does not take account of your objectives, or your financial situation. We aim to bring you long-term focused analysis driven by fundamental data. Note that our analysis may not factor in the latest price-sensitive company announcements or qualitative material. Simply Wall St has no position in any stocks mentioned.
Have feedback on this article? Concerned about the content? Get in touch with us directly. Alternatively, email editorial-team@simplywallst.com