
- LIVE QUOTES
- LEARN
- HELP
 Nasdaq
 Wall Street Journal
EN
Hong Leong Asia (SGX:H22): Valuation Check After Data-Centre Engine Launch and Ongoing Construction Upswing
Hong Leong Asia (SGX:H22) has drawn fresh attention after its China Yuchai arm rolled out new high horsepower generator engines aimed at the fast expanding data centre backup power market, increasing focus on its potential growth runway.
See our latest analysis for Hong Leong Asia.
The market seems to be recognising that story, with the share price at S$2.19 after a 1 day share price return of 3.79 percent, capping an impressive year to date share price return of 131.75 percent and a 1 year total shareholder return of 167.02 percent. This suggests momentum is still firmly building rather than fading.
If this kind of cyclical growth plus structural demand theme appeals to you, it could be a good moment to explore fast growing stocks with high insider ownership as potential next candidates for your watchlist.
But after a stunning 12 month rally, with shares still trading at a near 29 percent discount to intrinsic value and below analyst targets, is there more upside ahead, or is the market already pricing in future growth?
Price to Earnings of 17.4x: Is it justified?
At the last close of S$2.19, Hong Leong Asia trades on a price to earnings ratio of 17.4 times, a level that looks demanding versus domestic peers but still modest in a wider regional context.
The price to earnings multiple compares what investors are currently willing to pay for each dollar of the company’s earnings. It is a key yardstick in capital intensive industrials where profits can be cyclical and margins thin. For Hong Leong Asia, it encapsulates expectations around the durability of its recent earnings acceleration and the sustainability of demand in powertrain solutions and building materials.
Compared with the average Singapore market machinery peer multiple of 9.7 times, investors are paying a hefty premium, suggesting the market is already factoring in stronger growth or higher quality earnings than many local competitors. However, against the broader Asian machinery industry average of 24.8 times, the same 17.4 times looks restrained, hinting that there could still be room for the valuation to drift closer to a level our work suggests is a fair price to earnings ratio of 18.9 times if execution stays on track.
Explore the SWS fair ratio for Hong Leong Asia
Result: Price to Earnings of 17.4x (ABOUT RIGHT)
However, investors should watch for a sharper than expected slowdown in China’s industrial cycle or delays in data centre investment, which could quickly cool sentiment.
Find out about the key risks to this Hong Leong Asia narrative.
Another View: Discounted Cash Flow Check
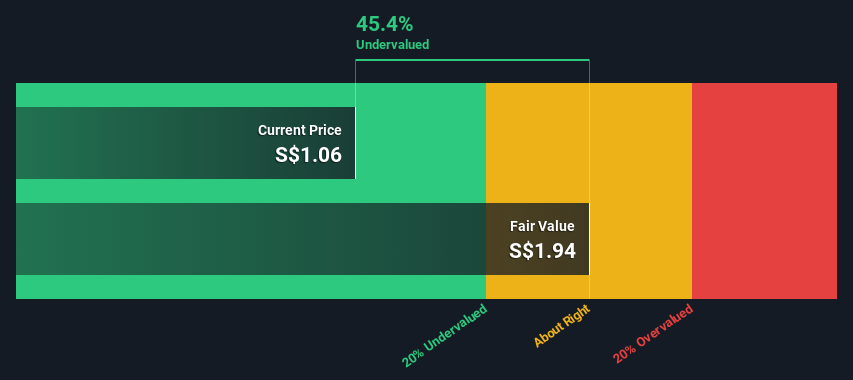
While the current price to earnings of 17.4 times looks broadly reasonable, our DCF model points to a fair value closer to S$3.08, implying a near 29 percent undervaluation. If both are correct, this raises the question of whether the market is still underestimating the cash flow potential behind the recent earnings upswing.
Look into how the SWS DCF model arrives at its fair value.
Simply Wall St performs a discounted cash flow (DCF) on every stock in the world every day (check out Hong Leong Asia for example). We show the entire calculation in full. You can track the result in your watchlist or portfolio and be alerted when this changes, or use our stock screener to discover 903 undervalued stocks based on their cash flows. If you save a screener we even alert you when new companies match - so you never miss a potential opportunity.
Build Your Own Hong Leong Asia Narrative
If you see the numbers differently or want to stress test your own assumptions, you can build a personalised view in just minutes: Do it your way.
A great starting point for your Hong Leong Asia research is our analysis highlighting 4 key rewards and 1 important warning sign that could impact your investment decision.
Ready for your next investing move?
Do not stop with one compelling story, use the Simply Wall St Screener now and line up your next smart opportunities before other investors react.
- Capture potential high growth at attractive prices by targeting companies that look undervalued on cash flow metrics through these 903 undervalued stocks based on cash flows today.
- Position yourself early in the next wave of innovation by screening for cutting edge opportunities with these 26 AI penny stocks before they become crowded trades.
- Lock in reliable income streams for your portfolio by focusing on quality payouts via these 13 dividend stocks with yields > 3% while yields remain compelling.
This article by Simply Wall St is general in nature. We provide commentary based on historical data and analyst forecasts only using an unbiased methodology and our articles are not intended to be financial advice. It does not constitute a recommendation to buy or sell any stock, and does not take account of your objectives, or your financial situation. We aim to bring you long-term focused analysis driven by fundamental data. Note that our analysis may not factor in the latest price-sensitive company announcements or qualitative material. Simply Wall St has no position in any stocks mentioned.
Have feedback on this article? Concerned about the content? Get in touch with us directly. Alternatively, email editorial-team@simplywallst.com