
- LIVE QUOTES
- LEARN
- HELP
 Nasdaq
 Wall Street Journal
EN
Has Centerra Gold’s 130% Surge in 2025 Already Priced In Future Growth?
- If you are looking at Centerra Gold and wondering whether you have already missed the value story or if there is still upside on the table, you are not alone.
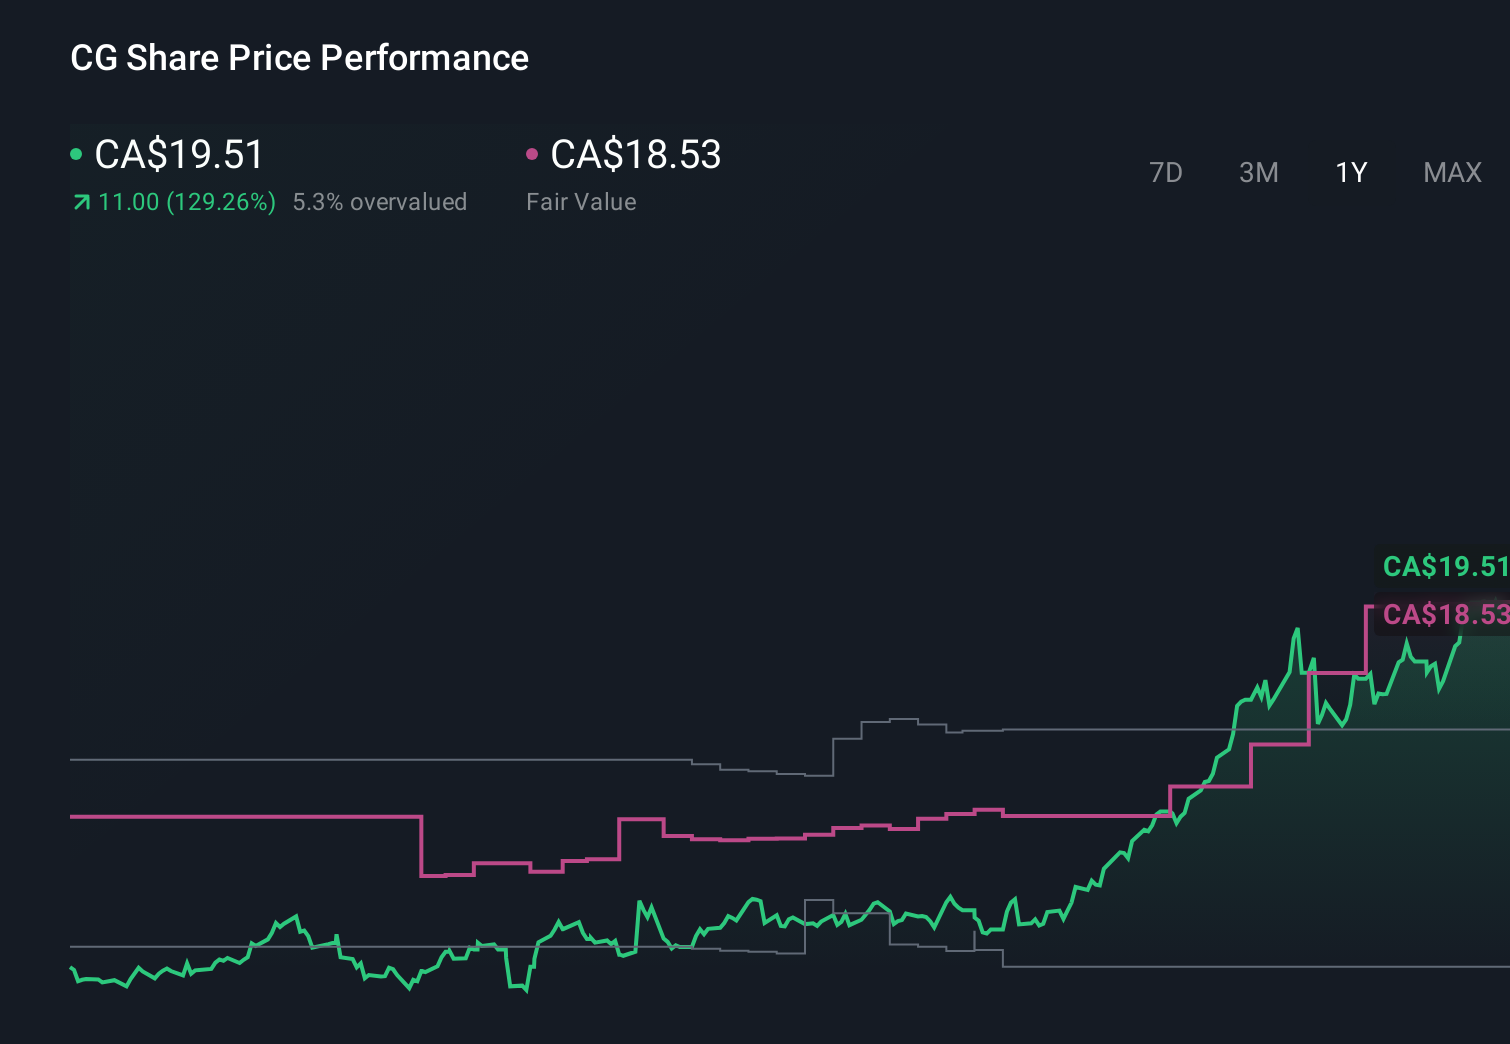
- The stock has surged lately, climbing 6.8% over the last week, 14.6% over the past month, and 129.8% year to date, with a 141.8% gain over the last year and 220.9% over three years reshaping how the market prices its risk and growth prospects.
- Recent moves have been driven by a mix of stronger gold price sentiment, progress on its key mining assets, and growing confidence that management can convert resources into reliable cash flow. Investors have also reacted to updates around operational stability and strategic portfolio decisions, which together have helped reframe Centerra Gold as more of a long term cash generator rather than a speculative miner.
- Despite this run up, Centerra Gold scores a 5/6 on our undervaluation checks, suggesting the market may still be underestimating its intrinsic worth. Next, we break down the different valuation approaches before circling back to another way to think about what this stock may be worth.
Approach 1: Centerra Gold Discounted Cash Flow (DCF) Analysis
A Discounted Cash Flow model estimates what a company is worth by projecting the cash it can generate in the future and discounting those cash flows back to today. For Centerra Gold, the model uses a 2 stage Free Cash Flow to Equity framework built on cash flow projections.
Centerra currently generates about $171.4 Million in free cash flow, and analysts expect this to grow steadily over time. By 2027, free cash flow is projected to reach roughly $209 Million, with further years extrapolated by Simply Wall St to around $294 Million by 2035 as growth moderates. These estimates are all expressed in $, the company’s reporting currency.
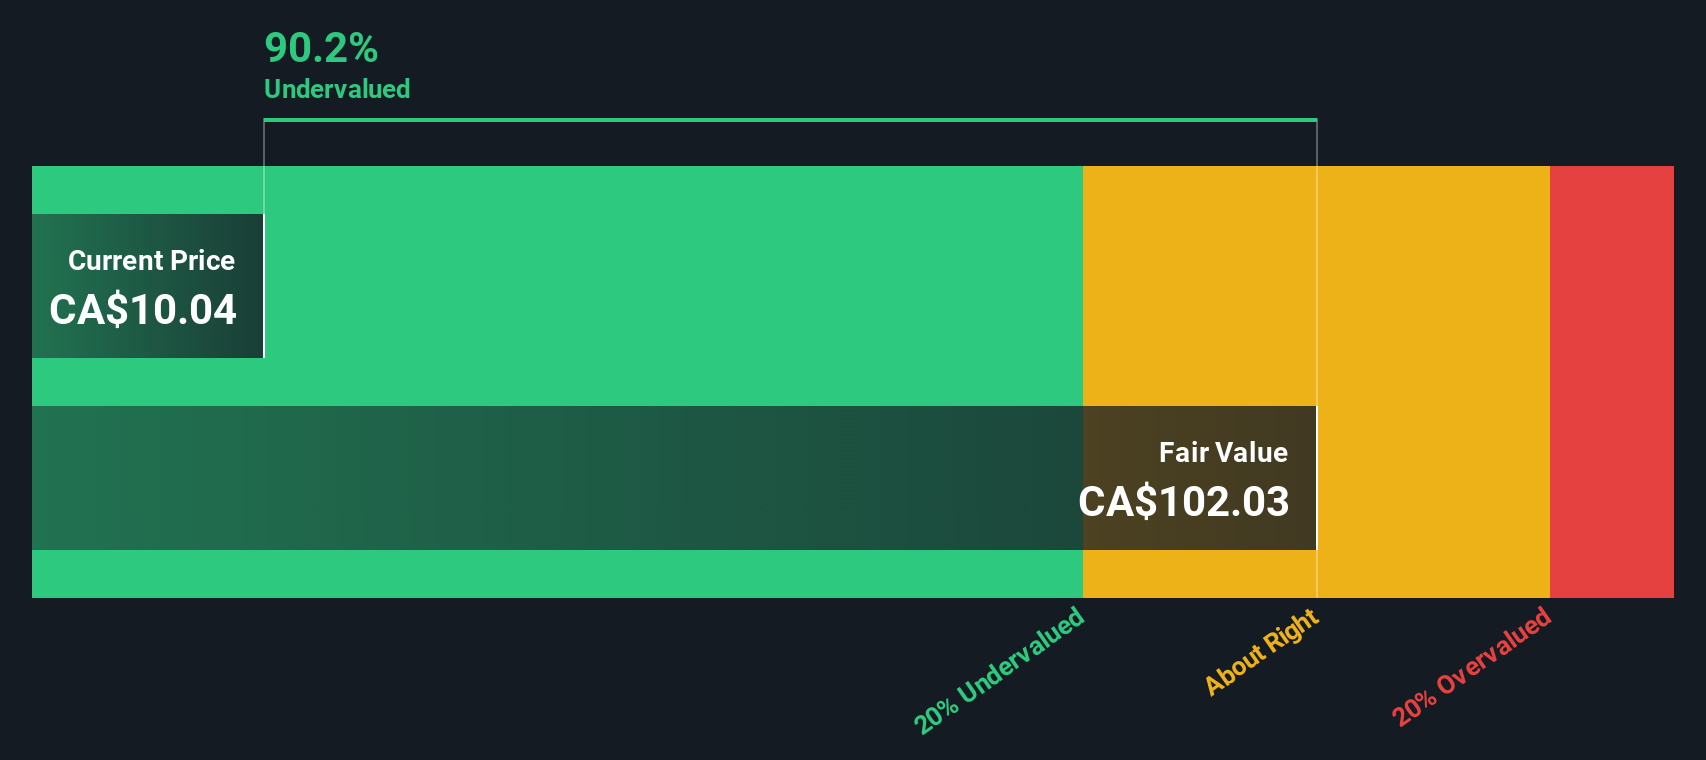
When these projected cash flows are discounted back to today, the model produces an estimated intrinsic value of CA$34.71 per share. Compared with the current share price, this implies the stock is about 43.8% undervalued, indicating that the market may not be fully pricing in Centerra Gold’s projected future cash generation potential according to this model.
Result: UNDERVALUED
Our Discounted Cash Flow (DCF) analysis suggests Centerra Gold is undervalued by 43.8%. Track this in your watchlist or portfolio, or discover 907 more undervalued stocks based on cash flows.
Approach 2: Centerra Gold Price vs Earnings
For profitable companies like Centerra Gold, the price to earnings ratio is a practical way to see how much investors are willing to pay for each dollar of current earnings. A higher PE can be justified when the market expects faster growth or sees the business as lower risk, while slower growth or higher uncertainty should usually mean a lower, more conservative PE.
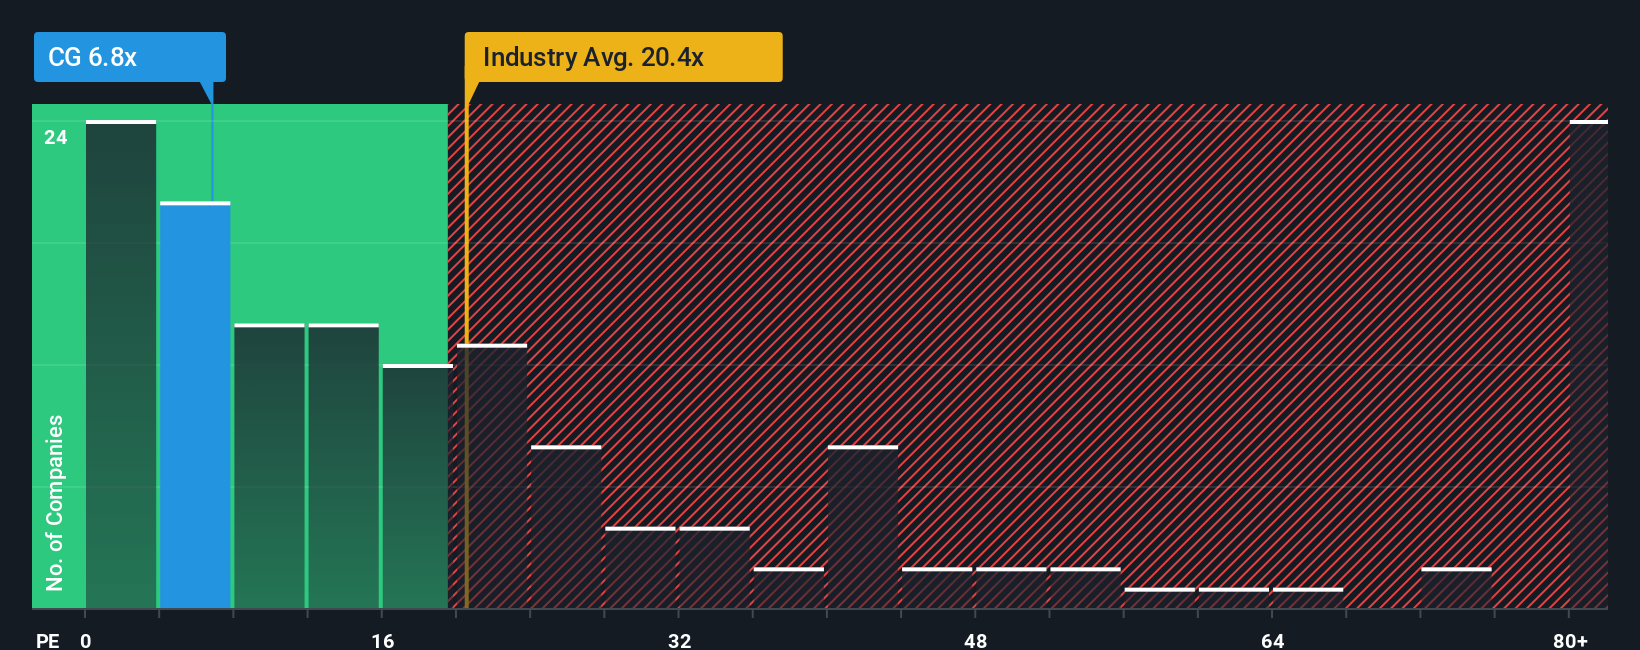
Centerra currently trades at about 8.4x earnings, which is well below both the Metals and Mining industry average of around 21.5x and the broader peer group average of roughly 25.9x. Simply Wall St also calculates a proprietary Fair Ratio of about 13.0x for Centerra, which reflects what the PE should be once you factor in its specific earnings growth outlook, margins, industry positioning, market cap and risk profile. This Fair Ratio is more tailored than a simple comparison to peers or the sector because it adjusts for Centerra’s own fundamentals rather than assuming all miners deserve similar multiples.
With the actual PE of 8.4x sitting notably below the Fair Ratio of 13.0x, this framework suggests Centerra Gold still screens as undervalued on an earnings multiple basis.
Result: UNDERVALUED
PE ratios tell one story, but what if the real opportunity lies elsewhere? Discover 1448 companies where insiders are betting big on explosive growth.
Upgrade Your Decision Making: Choose your Centerra Gold Narrative
Earlier we mentioned that there is an even better way to understand valuation, so let us introduce you to Narratives, a simple way to attach your story about Centerra Gold to the numbers by linking what you believe about its projects, risks, and strategy to a concrete forecast for future revenue, earnings, and margins. This then flows through to a Fair Value you can compare to today’s share price to see if it looks like a buy, hold, or sell. Narratives on Simply Wall St, available on the Community page used by millions of investors, are easy to create and update automatically as new news, guidance, or earnings drop, so your view stays alive rather than frozen in time. For Centerra Gold, for example, a more optimistic Narrative might lean toward the higher end of analyst expectations, closer to CA$14.86, assuming strong execution on growth projects and buybacks. A more cautious Narrative might anchor nearer CA$9.48, focusing on operational and cost risks. Both perspectives are translated into dynamic Fair Values that move as reality unfolds.
Do you think there's more to the story for Centerra Gold? Head over to our Community to see what others are saying!
This article by Simply Wall St is general in nature. We provide commentary based on historical data and analyst forecasts only using an unbiased methodology and our articles are not intended to be financial advice. It does not constitute a recommendation to buy or sell any stock, and does not take account of your objectives, or your financial situation. We aim to bring you long-term focused analysis driven by fundamental data. Note that our analysis may not factor in the latest price-sensitive company announcements or qualitative material. Simply Wall St has no position in any stocks mentioned.
Have feedback on this article? Concerned about the content? Get in touch with us directly. Alternatively, email editorial-team@simplywallst.com