
- PRICING
- LIVE QUOTES
- LEARN
- HELP


EN
Is Brookfield Asset Management Attractive After Recent Pullback and Expansion in Alternative Assets?
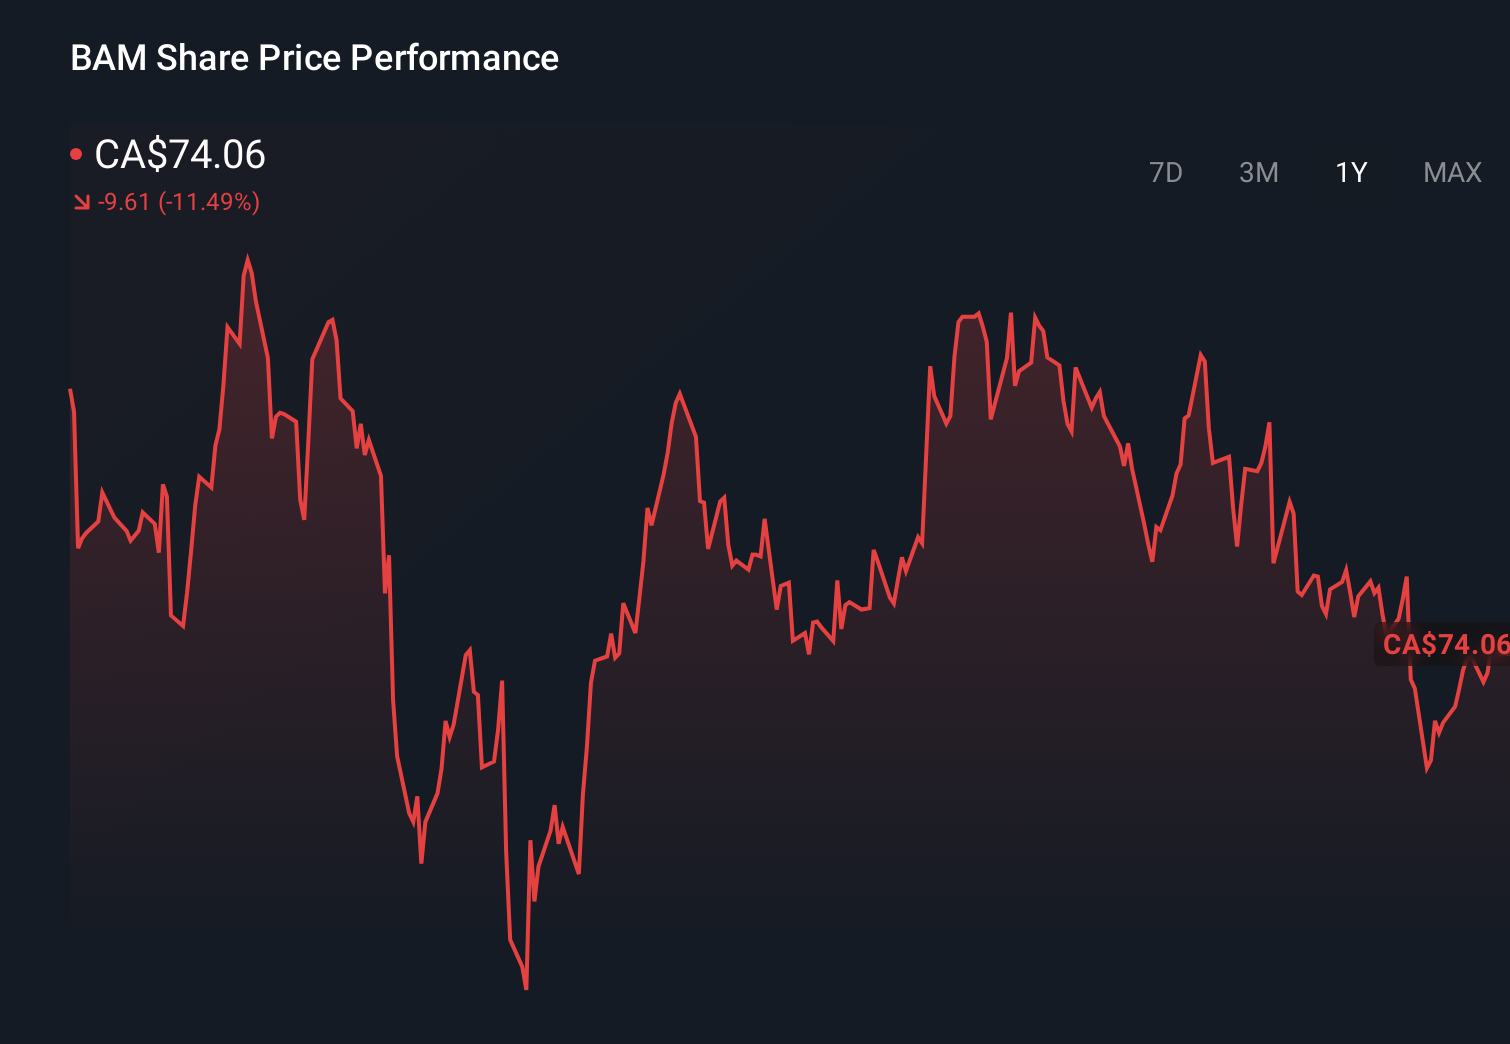
- If you have ever wondered whether Brookfield Asset Management at around $74 is a bargain or a value trap, you are not alone. This article is going to unpack exactly what that current price really implies.
- The stock has slipped about 5.5% year to date and is down 6.5% over the last year, even though it has surged roughly 121.5% over the past three years, a pattern that hints at both strong long term momentum and a recent cooling of enthusiasm.
- Recent headlines have focused on Brookfield doubling down on its role as a global alternative asset manager, including new infrastructure and renewable energy capital commitments that reinforce its fee based, asset light model. At the same time, ongoing macro uncertainty around interest rates and commercial real estate has kept some investors cautious, helping to explain the more muted short term share price performance.
- On our framework, Brookfield Asset Management currently scores just 1 out of 6 on valuation checks, suggesting it only looks undervalued on a single metric. In the sections that follow, we will dig into those different valuation approaches and, by the end, explore an even better way to think about what this business is really worth.
Brookfield Asset Management scores just 1/6 on our valuation checks. See what other red flags we found in the full valuation breakdown.
Approach 1: Brookfield Asset Management Excess Returns Analysis
The Excess Returns model looks at how much profit a company can generate above the return investors demand on its equity, then capitalizes those surplus profits into an intrinsic value per share.
For Brookfield Asset Management, the starting point is a Book Value of CA$5.25 per share and a Stable EPS of CA$2.22 per share, based on weighted future Return on Equity estimates from 5 analysts. With an Average Return on Equity of 36.24% and a Stable Book Value expected to rise to CA$6.13 per share, the business is modeled as continuing to earn strong returns on its equity base.
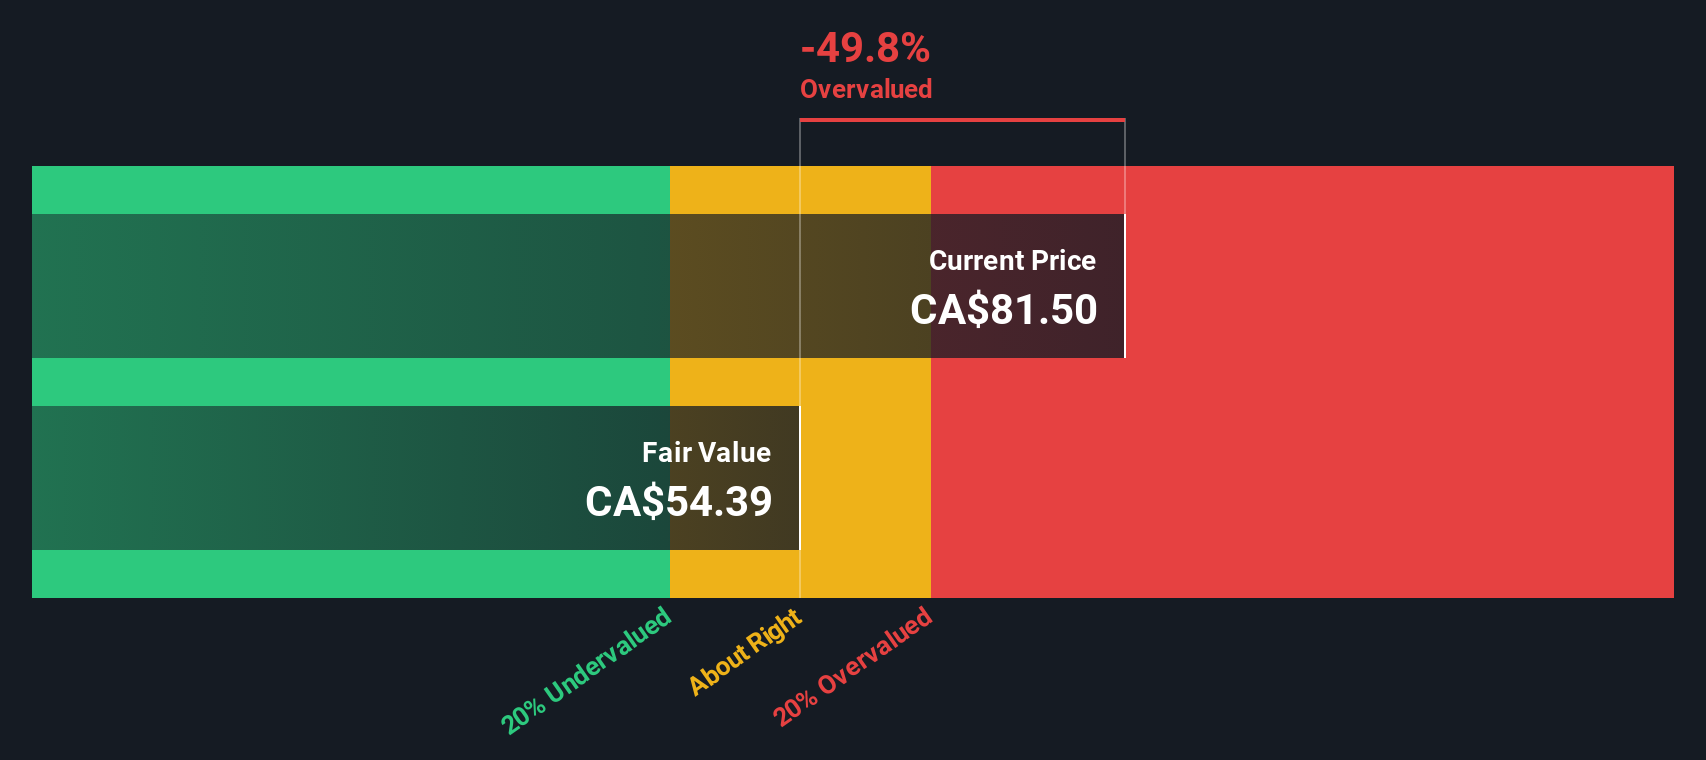
The Cost of Equity is estimated at CA$0.47 per share, implying an Excess Return of CA$1.75 per share once investor expectations are covered. When these excess returns are projected forward and discounted, the model arrives at an intrinsic value of about CA$57.77 per share, which is roughly 28.2% below the current market price near CA$74. In this framework, the shares appear materially overvalued.
Result: OVERVALUED
Our Excess Returns analysis suggests Brookfield Asset Management may be overvalued by 28.2%. Discover 907 undervalued stocks or create your own screener to find better value opportunities.
Approach 2: Brookfield Asset Management Price vs Earnings
For consistently profitable companies like Brookfield Asset Management, the Price to Earnings, or PE, ratio is a useful way to judge whether investors are paying a reasonable price for each dollar of current earnings. In general, faster growing and lower risk businesses should justify a higher PE multiple, while slower growth or riskier earnings streams should trade on a lower one.
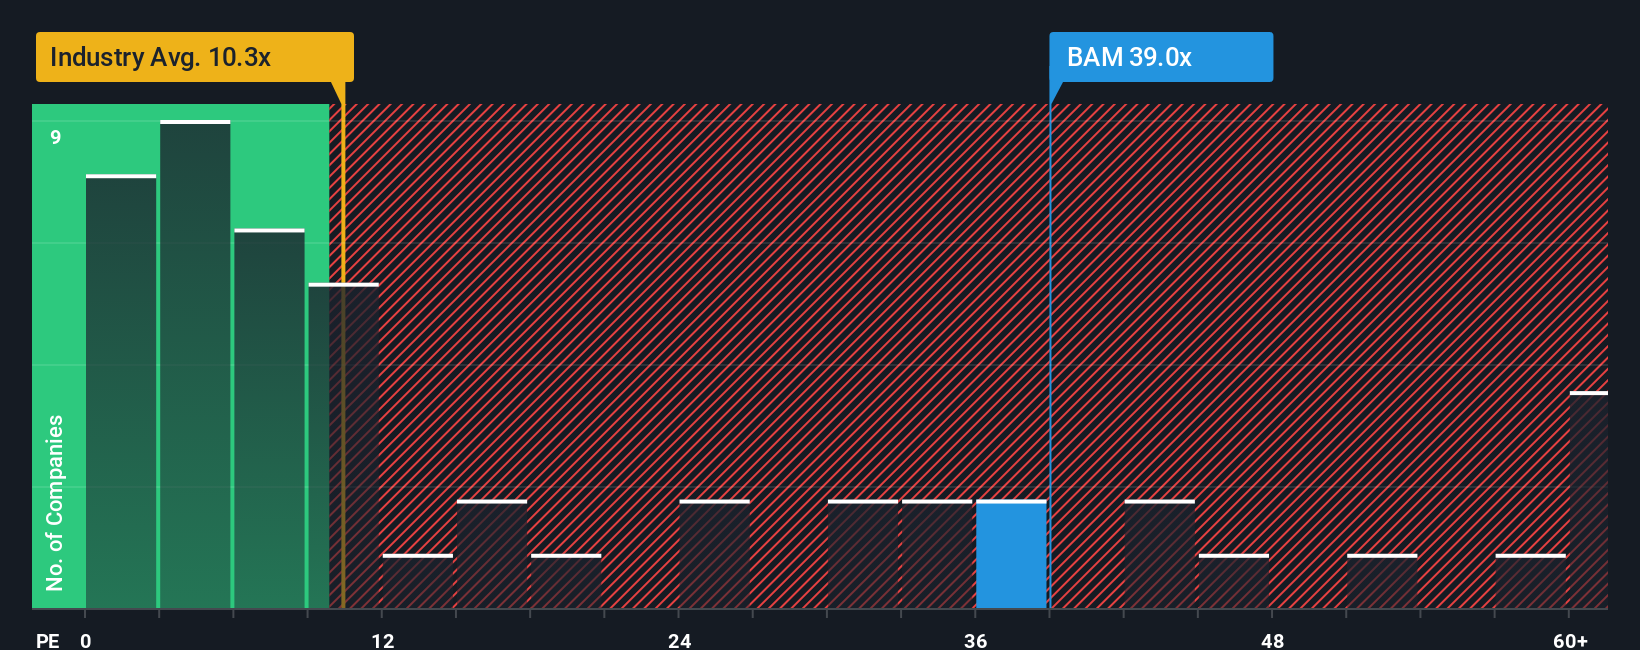
Brookfield Asset Management currently trades on a PE of about 33.2x, which is well above the broader Capital Markets industry average near 8.8x and also ahead of its peer group average of roughly 49.5x. To move beyond these blunt comparisons, Simply Wall St calculates a proprietary Fair Ratio of 24.1x for Brookfield, which reflects its specific earnings growth profile, profitability, risk factors, industry positioning and market capitalization. This tailored Fair Ratio is more informative than a simple peer or industry comparison because it adjusts for what actually makes Brookfield different rather than assuming all capital markets firms deserve the same multiple.
With the current PE of 33.2x sitting meaningfully above the Fair Ratio of 24.1x, the shares look expensive on an earnings based lens.
Result: OVERVALUED
PE ratios tell one story, but what if the real opportunity lies elsewhere? Discover 1448 companies where insiders are betting big on explosive growth.
Upgrade Your Decision Making: Choose your Brookfield Asset Management Narrative
Earlier we mentioned that there is an even better way to understand valuation, so let us introduce you to Narratives, which are simply your story about a company translated into numbers like fair value, future revenue, earnings and margins. A Narrative on Simply Wall St links three things together in one place: the company’s story, a financial forecast built from your assumptions, and the fair value that falls out of those forecasts. Because Narratives live in the Community section of the Simply Wall St platform, which is used by millions of investors, they are easy to create, browse and compare, helping you see how other investors are thinking about Brookfield Asset Management. Narratives also make buy or sell decisions more straightforward by letting you compare your Fair Value directly with the current Price, and they automatically update when fresh news, results or other data points come in. For example, one Brookfield Asset Management Narrative might assume high growth and strong margins that justify a Fair Value well above today’s price, while another might bake in slower growth and more risk, resulting in a Fair Value well below the market.
Do you think there's more to the story for Brookfield Asset Management? Head over to our Community to see what others are saying!
This article by Simply Wall St is general in nature. We provide commentary based on historical data and analyst forecasts only using an unbiased methodology and our articles are not intended to be financial advice. It does not constitute a recommendation to buy or sell any stock, and does not take account of your objectives, or your financial situation. We aim to bring you long-term focused analysis driven by fundamental data. Note that our analysis may not factor in the latest price-sensitive company announcements or qualitative material. Simply Wall St has no position in any stocks mentioned.
Have feedback on this article? Concerned about the content? Get in touch with us directly. Alternatively, email editorial-team@simplywallst.com