
- LIVE QUOTES
- LEARN
- HELP
 Nasdaq
 Wall Street Journal
EN
Is JinkoSolar Attractive After Recent Price Rebound and Massive Valuation Gap in 2025
- Wondering if JinkoSolar Holding at around $25.64 is a bargain or a value trap? You are not alone. This stock often flies under the radar despite big swings in sentiment.
- Over the last week the share price is up 5.9%, but that bounce comes after a choppy stretch, with the stock down 6.1% over 30 days and still negative over 1 year and even more over 3 and 5 years.
- Recently, JinkoSolar has stayed in the spotlight with ongoing headlines about global clean energy policy shifts and intensifying price competition across solar module makers. Both of these factors shape how investors think about long term profitability. At the same time, industry chatter around supply chain realignment and capacity expansions has kept solar names like JinkoSolar front of mind for investors trying to gauge where the next cycle will settle.
- On our checklist of six valuation tests, JinkoSolar scores a 5 out of 6, which strongly hints at undervaluation but also raises questions about what the market is still worried about. Next, we will break down the key valuation methods behind that score and later explore a more complete way to think about the company’s true worth.
Find out why JinkoSolar Holding's -2.3% return over the last year is lagging behind its peers.
Approach 1: JinkoSolar Holding Discounted Cash Flow (DCF) Analysis
A Discounted Cash Flow model estimates what a company is worth by projecting the cash it can generate in the future and then discounting those cash flows back to today.
For JinkoSolar, the latest twelve month free cash flow is about CN¥4.9 billion, and analysts expect this to keep growing as the business scales. Simply Wall St uses analyst estimates for the next few years and then extrapolates them out to 10 years, arriving at projected free cash flow of roughly CN¥5.3 billion by 2035. These future cash flows are then discounted back using a required rate of return under a 2 Stage Free Cash Flow to Equity model.
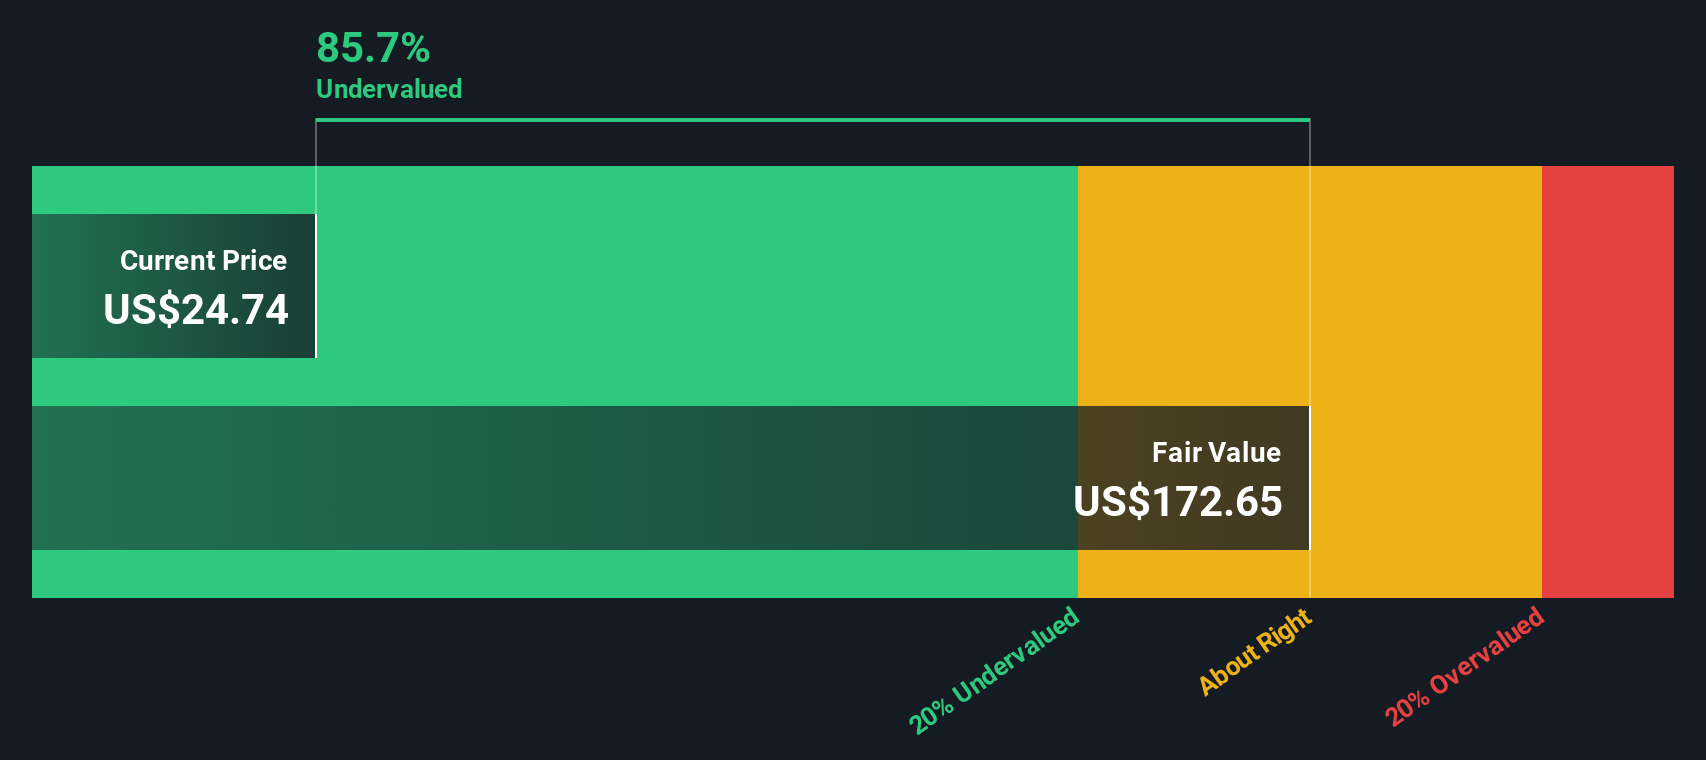
On this basis, the estimated intrinsic value for JinkoSolar is US$82.23 per share, compared with a current market price of about US$25.64. That implies the stock is trading at roughly a 68.8% discount to its DCF based fair value, which indicates the market is pricing in a lot of risk or skepticism.
Result: UNDERVALUED
Our Discounted Cash Flow (DCF) analysis suggests JinkoSolar Holding is undervalued by 68.8%. Track this in your watchlist or portfolio, or discover 907 more undervalued stocks based on cash flows.
Approach 2: JinkoSolar Holding Price vs Sales
For companies like JinkoSolar where earnings can swing with the cycle, the Price to Sales ratio is a useful way to compare how much investors are paying for each dollar of revenue, without profits distorting the picture.
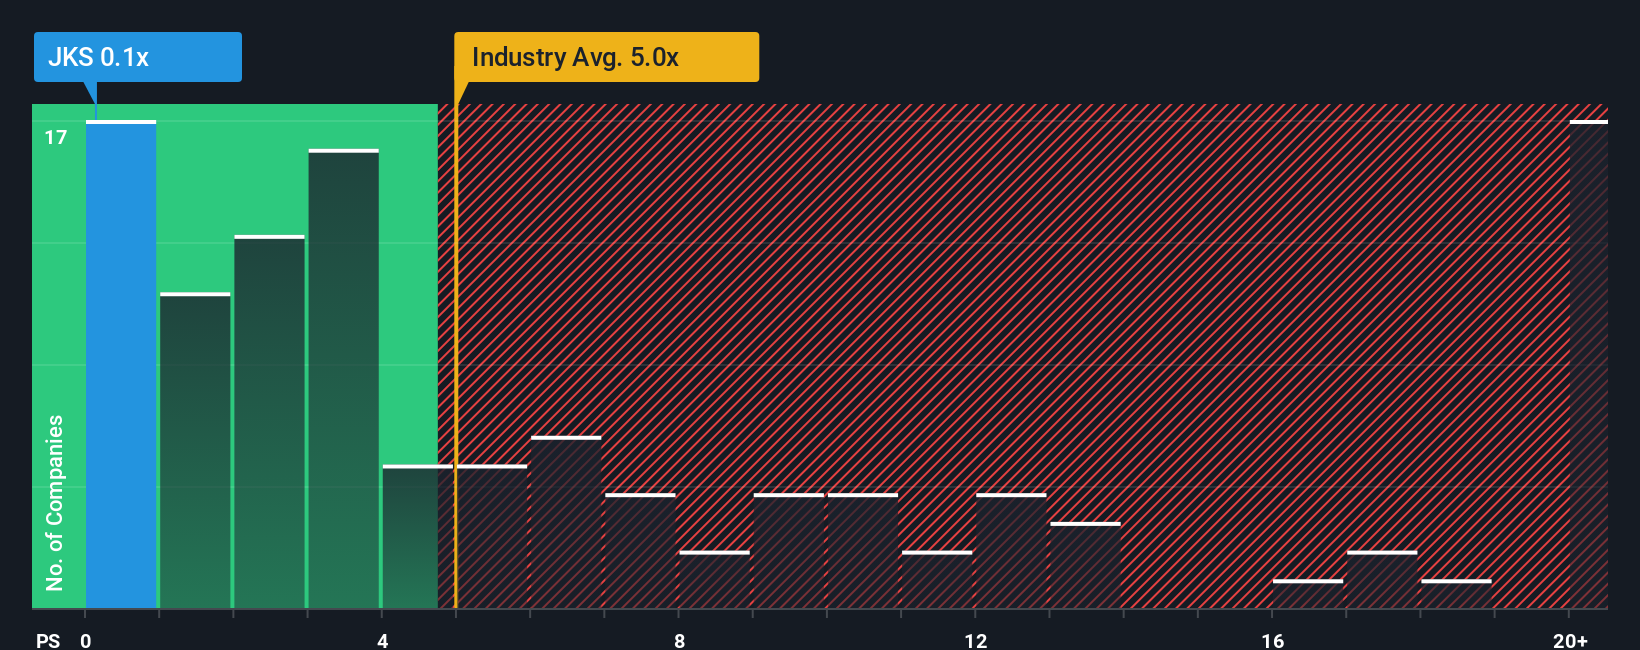
In general, faster growth and lower risk justify a higher sales multiple, while slower or uncertain growth, thinner margins and higher risk usually warrant a discount. Today, JinkoSolar trades on a very low Price to Sales ratio of about 0.14x compared with the Semiconductor industry average of around 5.41x and a peer group average near 0.92x. This highlights how pessimistic the market currently is about its revenue quality and sustainability.
Simply Wall St also calculates a proprietary Fair Ratio of 1.41x for JinkoSolar. This is the Price to Sales multiple you might expect when factoring in its growth outlook, profit margins, risk profile, industry and market cap. It is therefore a more tailored benchmark than a simple comparison with peers or the broad industry. Since the Fair Ratio of 1.41x sits well above the current 0.14x, the shares screen as materially undervalued on this metric.
Result: UNDERVALUED
PS ratios tell one story, but what if the real opportunity lies elsewhere? Discover 1448 companies where insiders are betting big on explosive growth.
Upgrade Your Decision Making: Choose your JinkoSolar Holding Narrative
Earlier we mentioned that there is an even better way to understand valuation, so let us introduce you to Narratives, which are simple stories that connect your view of JinkoSolar’s business, like how fast revenue, earnings and margins might grow, to a financial forecast and then to your own estimate of fair value.
On Simply Wall St’s Community page, millions of investors use Narratives as an easy, interactive tool to spell out their assumptions, turn those into projected financials, and instantly see what they think the shares are really worth compared to today’s price, helping them decide whether JinkoSolar looks like a buy, a hold, or a sell.
Because Narratives update dynamically when fresh information comes in, such as new earnings, policy news or shipment guidance, they evolve with the story instead of locking you into a static view.
For example, one JinkoSolar Narrative might lean bullish, expecting energy storage growth and margin recovery to support a fair value closer to the upper analyst target of about US$66 per share. A more cautious Narrative, focused on policy headwinds and pricing pressure, could point to a fair value nearer the low end of around US$17. Comparing either figure to the current share price is what ultimately guides the investment decision.
Do you think there's more to the story for JinkoSolar Holding? Head over to our Community to see what others are saying!

This article by Simply Wall St is general in nature. We provide commentary based on historical data and analyst forecasts only using an unbiased methodology and our articles are not intended to be financial advice. It does not constitute a recommendation to buy or sell any stock, and does not take account of your objectives, or your financial situation. We aim to bring you long-term focused analysis driven by fundamental data. Note that our analysis may not factor in the latest price-sensitive company announcements or qualitative material. Simply Wall St has no position in any stocks mentioned.
Have feedback on this article? Concerned about the content? Get in touch with us directly. Alternatively, email editorial-team@simplywallst.com