
- LIVE QUOTES
- LEARN
- HELP
 Nasdaq
 Wall Street Journal
EN
Has Under Armour’s Share Slide Created a Long Term Opportunity in 2025?
- If you have been wondering whether Under Armour is a bargain or a value trap at these levels, you are not alone. This piece is going to walk through what the current price really implies.
- Despite the brand’s global recognition, the stock has been sliding, with shares down 4.8% over the last week, 10.0% over the last month, and a much steeper 46.5% year to date, adding up to a 50.9% drop over the past year.
- That kind of long slide, including a 57.3% loss over three years and 75.1% over five, has been driven by a mix of concerns around the company’s turnaround progress, competitive pressure in athletic apparel, and shifting consumer demand patterns. Recent headlines have focused on strategy resets, brand repositioning efforts, and management’s attempts to streamline the business, all of which help explain why the market is still skeptical.
- On our framework, Under Armour scores a 3/6 valuation score. This means it looks undervalued on half of the key checks we run. In the sections ahead we will unpack those methods in detail and then finish with a more intuitive way to think about what the stock might really be worth.
Find out why Under Armour's -50.9% return over the last year is lagging behind its peers.
Approach 1: Under Armour Discounted Cash Flow (DCF) Analysis
A Discounted Cash Flow model estimates what a business is worth by projecting the cash it can generate in the future and discounting those cash flows back to today in dollar terms. For Under Armour, the 2 Stage Free Cash Flow to Equity model starts from a weak base, with last twelve month free cash flow of about $47.8 Million in the red.
Analysts expect a sharp recovery, with free cash flow projected to swing positive and reach around $53 Million by 2030. The nearer term path is bumpy, moving from roughly $43.3 Million negative in 2026 to just under $120 Million in 2027, before normalising to the $50 Million range later in the next decade, with later years extrapolated from limited analyst inputs.
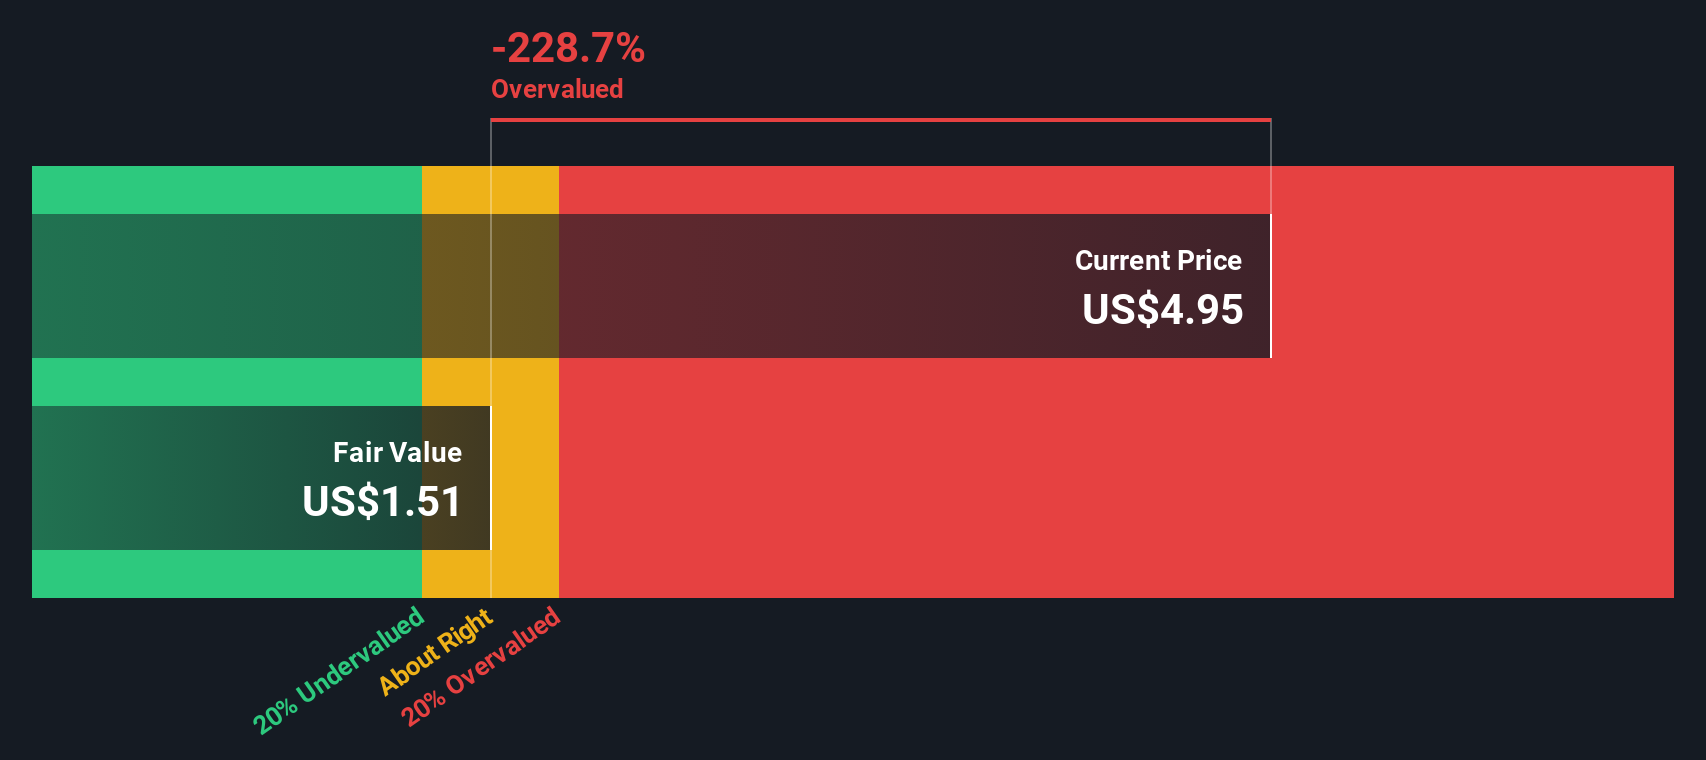
When these projected cash flows are discounted back, the implied fair value from the DCF model is only about $1.09 per share, suggesting the stock is roughly 296.1% overvalued versus the current market price.
Result: OVERVALUED
Our Discounted Cash Flow (DCF) analysis suggests Under Armour may be overvalued by 296.1%. Discover 907 undervalued stocks or create your own screener to find better value opportunities.
Approach 2: Under Armour Price vs Sales
For companies where profits are thin or volatile, the price to sales ratio is often a more reliable yardstick than earnings based metrics, because revenue is usually more stable and less affected by short term restructuring or margin swings.
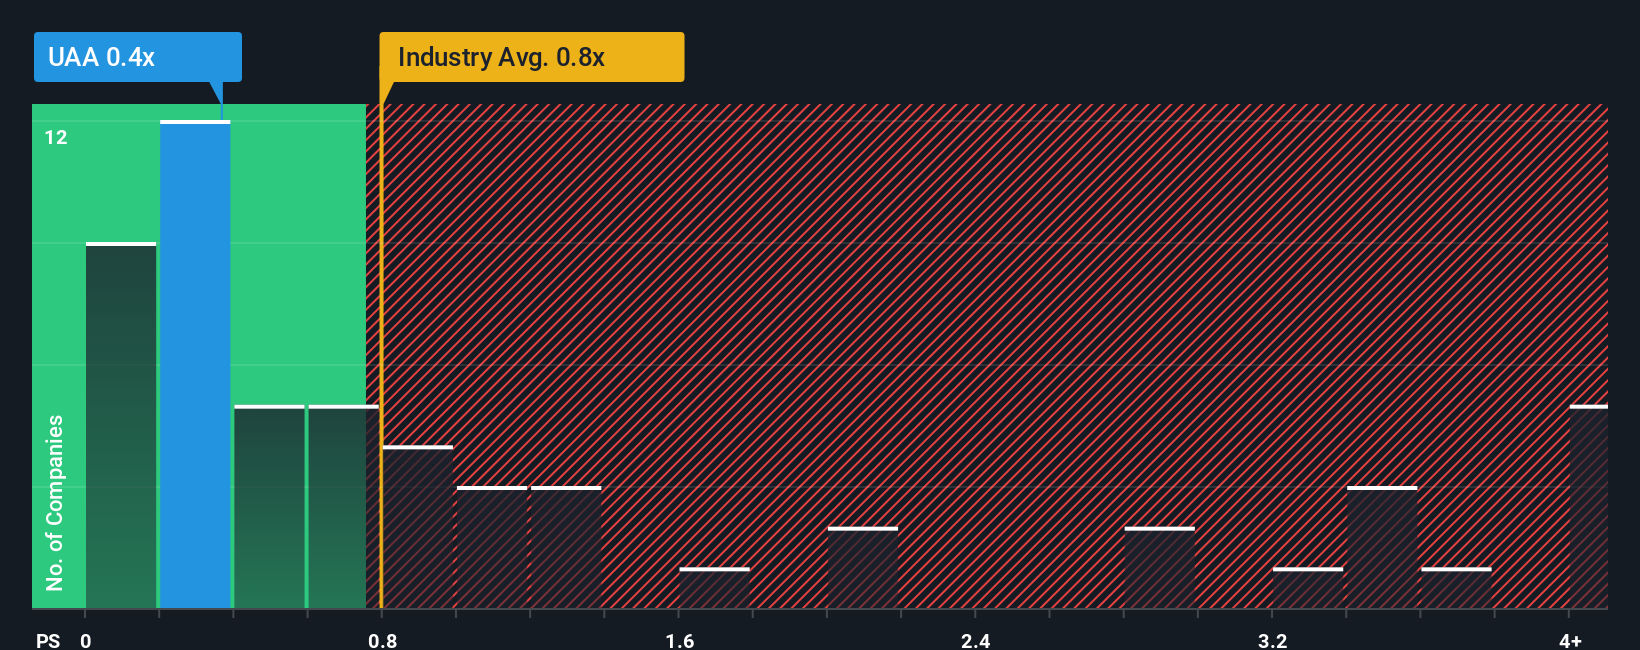
In general, faster growing, higher margin, lower risk companies can justify a higher price to sales multiple, while slower growth or riskier businesses should trade at a discount. Under Armour currently trades on a price to sales ratio of about 0.36x, which is well below both the Luxury industry average of around 0.79x and the broader peer group average of roughly 1.29x.
Simply Wall St also calculates a Fair Ratio of 0.88x for Under Armour, which is the price to sales multiple the company might reasonably deserve given its specific mix of growth prospects, profitability, industry position, size and risk profile. This firm specific yardstick is more informative than a simple peer or industry comparison, because it adjusts for the fact that not all brands or balance sheets are created equal. Compared with the Fair Ratio, Under Armour's current 0.36x multiple suggests the shares are meaningfully undervalued on this metric.
Result: UNDERVALUED
PS ratios tell one story, but what if the real opportunity lies elsewhere? Discover 1448 companies where insiders are betting big on explosive growth.
Upgrade Your Decision Making: Choose your Under Armour Narrative
Earlier we mentioned that there is an even better way to understand valuation, so let us introduce you to Narratives, which are simply your own story about a company, tied directly to assumptions for its future revenue, earnings, margins and ultimately what you think its fair value should be.
On Simply Wall St, Narratives live on the Community page and give you an easy way to link a company’s story, a structured financial forecast and a fair value estimate in one place, so you can quickly see whether your view suggests the stock is worth buying, holding or selling at today’s price.
Because Narratives on the platform are updated dynamically as new information like earnings or major news drops in, they help you continuously compare your Fair Value to the current Price and decide if the gap between them still makes sense based on what you believe will happen next.
For Under Armour, for example, one bullish Narrative might lean toward the higher analyst fair value of around $13.80 on the view that brand elevation and international expansion will drive stronger growth and margin recovery, while a more cautious Narrative could sit closer to $4.00 if you expect tariff pressure, weak footwear demand and slower revenue growth to persist.
Do you think there's more to the story for Under Armour? Head over to our Community to see what others are saying!

This article by Simply Wall St is general in nature. We provide commentary based on historical data and analyst forecasts only using an unbiased methodology and our articles are not intended to be financial advice. It does not constitute a recommendation to buy or sell any stock, and does not take account of your objectives, or your financial situation. We aim to bring you long-term focused analysis driven by fundamental data. Note that our analysis may not factor in the latest price-sensitive company announcements or qualitative material. Simply Wall St has no position in any stocks mentioned.
Have feedback on this article? Concerned about the content? Get in touch with us directly. Alternatively, email editorial-team@simplywallst.com