
- LIVE QUOTES
- LEARN
- HELP
 Nasdaq
 Wall Street Journal
EN
Does Rising Cash Flow Justify HCA Healthcare’s 2025 Share Price Surge?
- If you are wondering whether HCA Healthcare is still worth buying after such a large share price rise, or if the easy money has already been made, this article will walk through whether the current price still stacks up against its fundamentals.
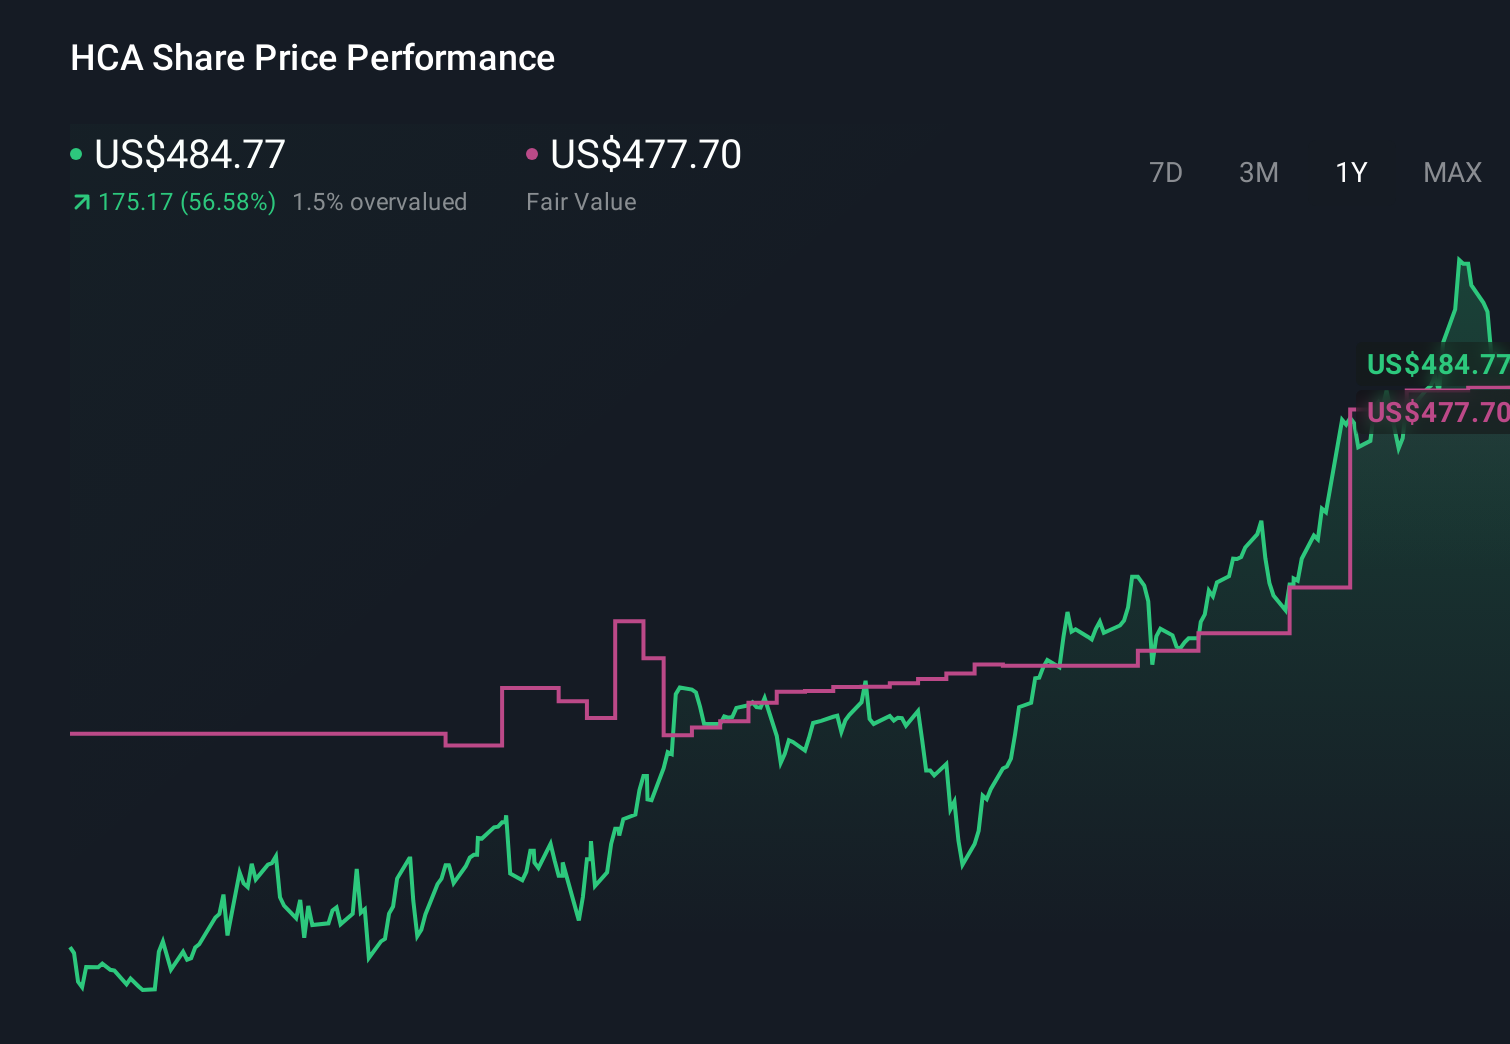
- Despite a small dip of 0.4% over the last week, HCA shares are up 2.4% over 30 days, 62.8% year to date, 55.3% over 1 year, 107.5% over 3 years, and 207.6% over 5 years, which naturally raises the question of how much upside is left from here.
- Recent moves have been driven by ongoing strength in US hospital utilization, continued cost discipline across its network, and investor optimism around structural demand for healthcare services. At the same time, headlines about reimbursement pressures, regulatory scrutiny, and staffing costs have kept some investors cautious, making it even more important to separate narrative from numbers.
- Right now, HCA scores a solid 5/6 on our valuation checks. This suggests the market may still be underestimating some of its cash flow strength. The bigger question is which valuation methods actually capture that story best, and we will finish by looking at an additional way to think about what this stock might be worth.
Approach 1: HCA Healthcare Discounted Cash Flow (DCF) Analysis
A Discounted Cash Flow, or DCF, model estimates what a company is worth by projecting its future cash flows and then discounting those projections back to what they are worth in today’s dollars.
For HCA Healthcare, the latest twelve months Free Cash Flow is about $7.7 billion. Analysts and internal estimates project this to rise steadily, with forecast Free Cash Flow of roughly $10.2 billion by 2035, based on a 2 Stage Free Cash Flow to Equity model that blends analyst forecasts with longer term extrapolations by Simply Wall St.
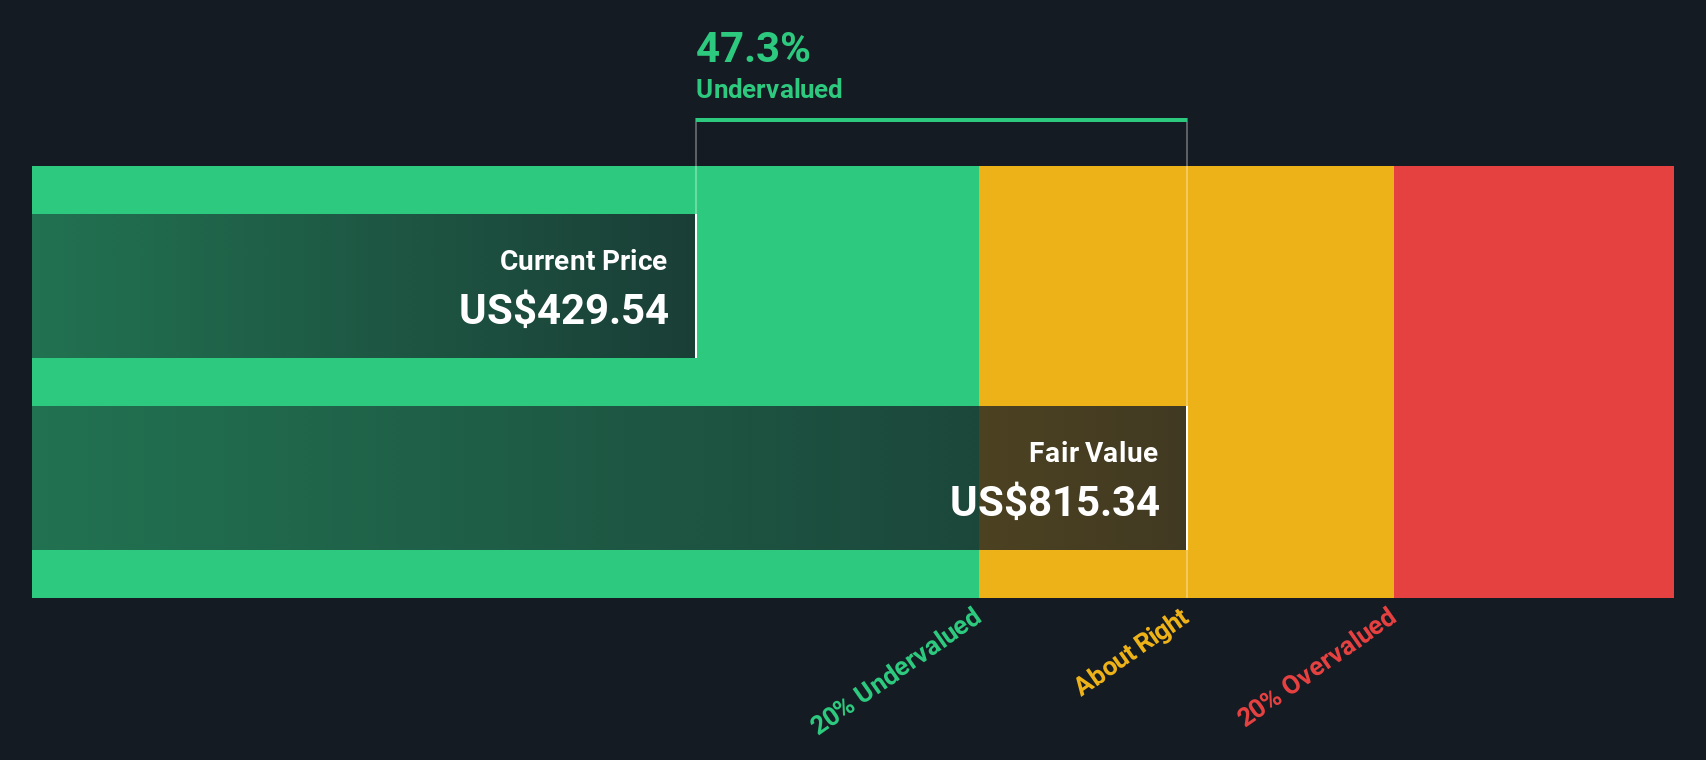
When these future cash flows are discounted back to today, the model arrives at an intrinsic value of about $899.69 per share. That implies HCA is trading at a 46.1% discount to its estimated fair value, indicating that the current market price may not fully reflect its cash generation potential.
On this DCF view, HCA Healthcare stock appears undervalued rather than fully priced.
Result: UNDERVALUED
Our Discounted Cash Flow (DCF) analysis suggests HCA Healthcare is undervalued by 46.1%. Track this in your watchlist or portfolio, or discover 907 more undervalued stocks based on cash flows.
Approach 2: HCA Healthcare Price vs Earnings
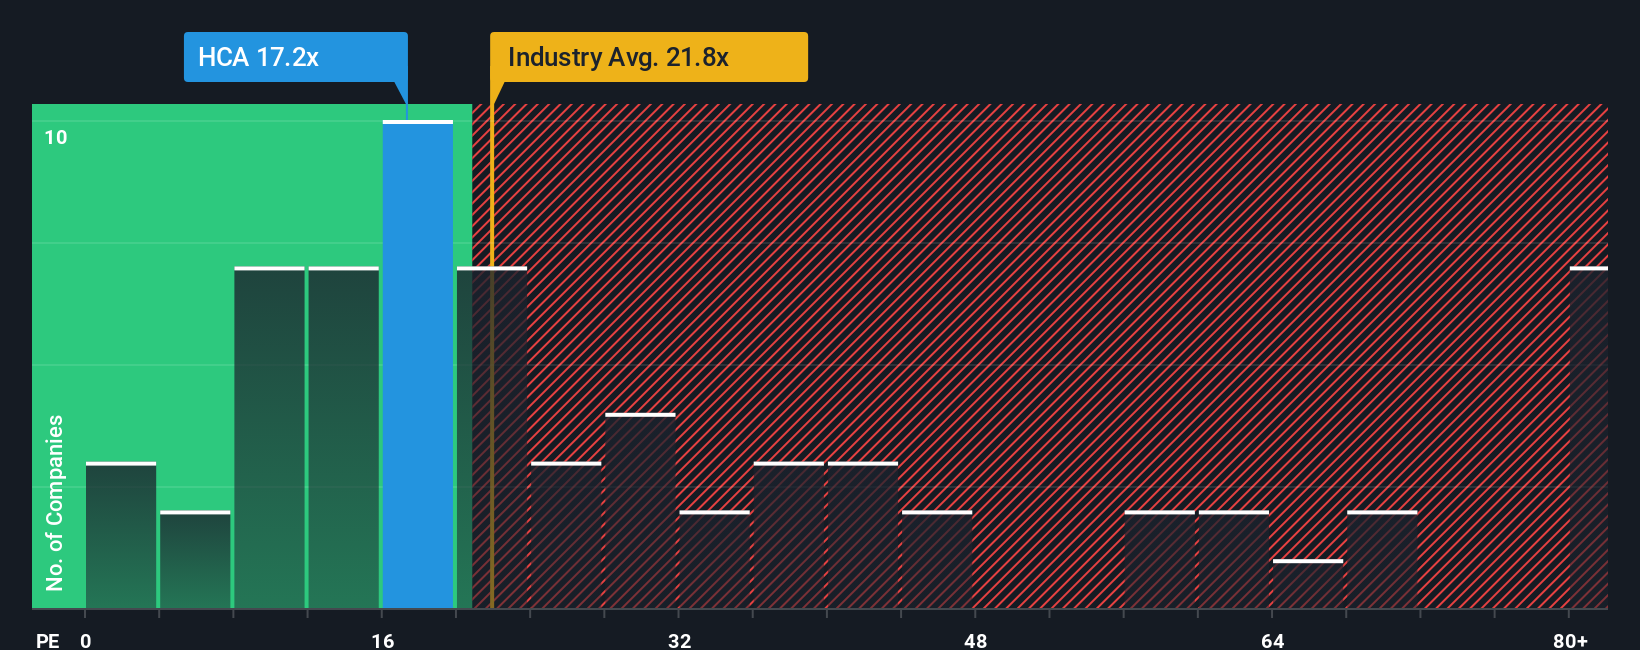
For a mature, consistently profitable company like HCA Healthcare, the Price to Earnings, or PE, ratio is a useful way to gauge how much investors are paying for each dollar of current earnings. In general, faster growth and lower perceived risk justify a higher PE, while slower growth or higher risk should lead to a lower, or discounted, multiple.
HCA currently trades on a PE of about 17.4x. That is slightly below both its peer group average of roughly 18.4x and the broader Healthcare industry average of about 23.7x, suggesting the market is pricing HCA at a modest discount to comparable names despite its strong track record.
Simply Wall St also uses a proprietary Fair Ratio, which estimates what PE multiple a stock should trade on given its earnings growth outlook, profitability, industry, market cap, and risk profile. For HCA, that Fair Ratio is 29.6x, materially above the current 17.4x. Because this measure is tailored to HCA’s fundamentals rather than just comparing it with peers, it can better highlight when a quality business is being underappreciated by the market. On this basis, HCA screens as undervalued on earnings.
Result: UNDERVALUED
PE ratios tell one story, but what if the real opportunity lies elsewhere? Discover 1448 companies where insiders are betting big on explosive growth.
Upgrade Your Decision Making: Choose your HCA Healthcare Narrative
Earlier we mentioned that there is an even better way to understand valuation, so let us introduce you to Narratives, which are simply your story about a company linked directly to your assumptions about its future revenue, earnings, margins and fair value. A Narrative turns your view on HCA Healthcare into a clear, financial roadmap by connecting three pieces: what you think will happen in the business, how that feeds into a forecast, and what price that forecast suggests the stock is really worth. On Simply Wall St, millions of investors explore and share these Narratives on the Community page, using them as an easy tool to decide when to buy or sell by comparing their Fair Value with today’s market Price, and seeing in real time how that gap changes as new news, guidance, or earnings hit the tape. For example, one HCA Narrative might lean bullish with a fair value closer to 477.7 dollars, while a more cautious Narrative might anchor near 333 dollars, yet both investors can track how changing assumptions about policy risk, supplemental payments, or volume growth shift their fair value and, ultimately, their decision.
Do you think there's more to the story for HCA Healthcare? Head over to our Community to see what others are saying!
This article by Simply Wall St is general in nature. We provide commentary based on historical data and analyst forecasts only using an unbiased methodology and our articles are not intended to be financial advice. It does not constitute a recommendation to buy or sell any stock, and does not take account of your objectives, or your financial situation. We aim to bring you long-term focused analysis driven by fundamental data. Note that our analysis may not factor in the latest price-sensitive company announcements or qualitative material. Simply Wall St has no position in any stocks mentioned.
Have feedback on this article? Concerned about the content? Get in touch with us directly. Alternatively, email editorial-team@simplywallst.com