
- LIVE QUOTES
- LEARN
- HELP
 Nasdaq
 Wall Street Journal
EN
Is It Too Late to Consider SoFi After Its 2025 Rally and Valuation Concerns?
- Wondering if SoFi Technologies is still a smart buy after its massive run up, or if you are late to the party? You are not alone, and that is exactly what we are going to unpack here.
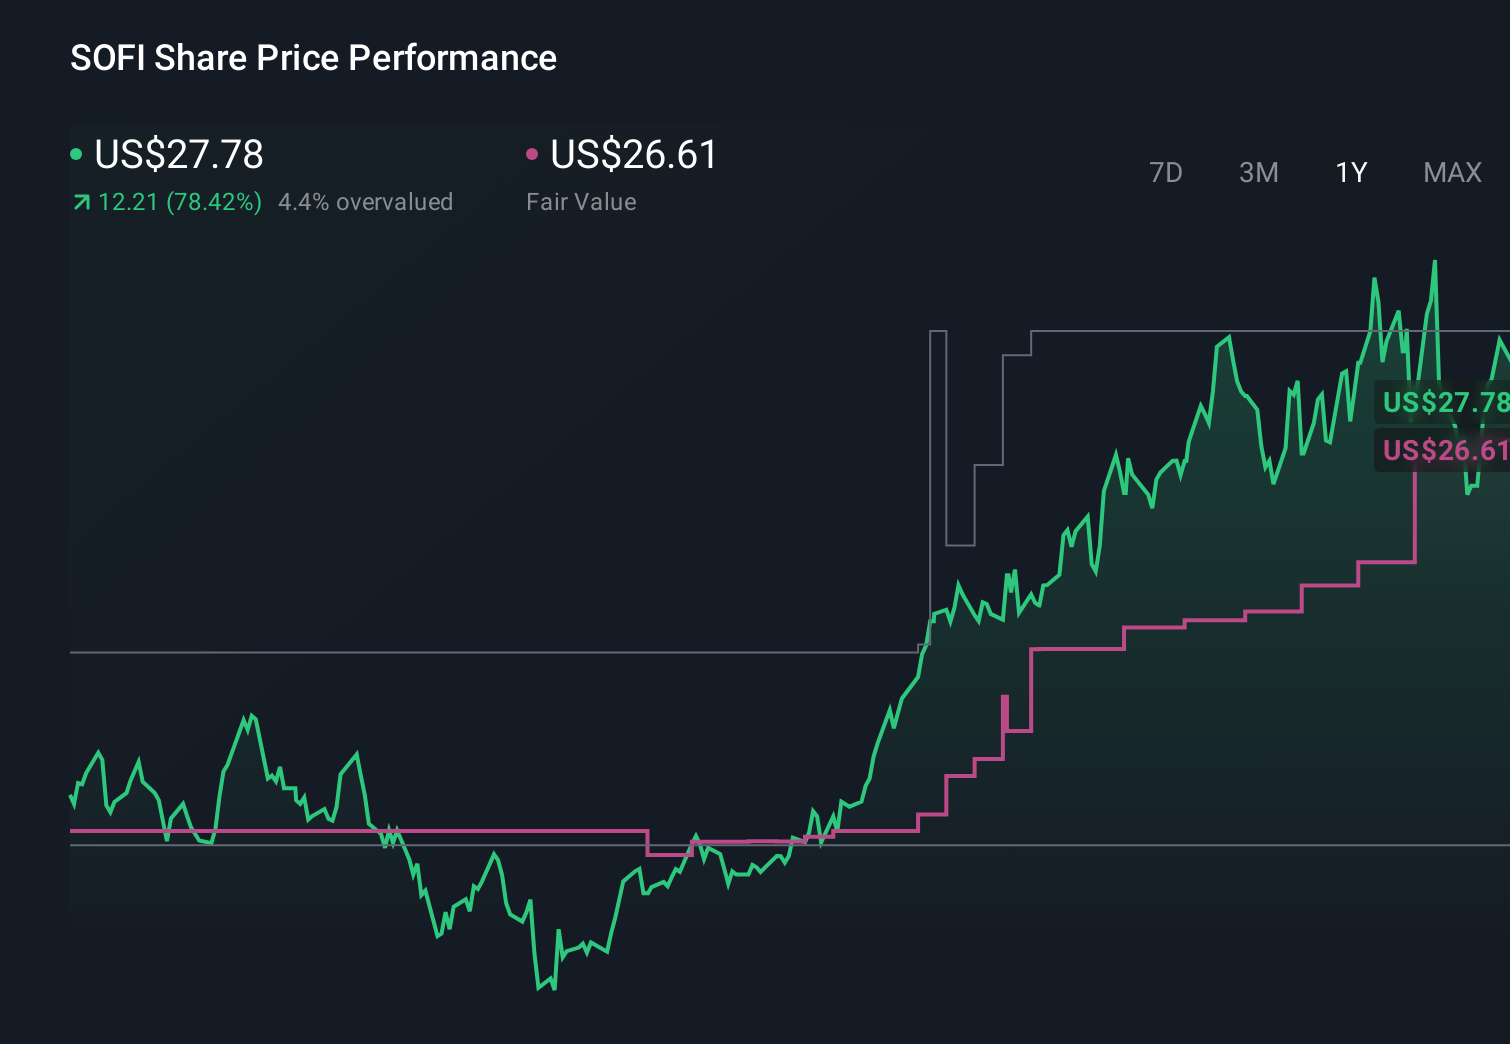
- Despite impressive long term gains of 93.1% year to date and 67.9% over the last year, the stock has cooled a bit recently, slipping 1.8% over the past week and 3.9% over the last month.
- Recent headlines have focused on SoFi expanding its product ecosystem, stepping up its push into traditional banking services, and leaning further into its technology platform for partners, which all help explain why sentiment has shifted from high risk fintech experiment to maturing financial platform. At the same time, renewed attention on student loan dynamics, consumer credit quality, and regulation has reminded investors that SoFi’s rapid growth story still comes with meaningful risk.
- On our numbers, SoFi scores just 0/6 on valuation checks, so in the sections ahead we will walk through what different valuation approaches are actually saying about the stock today, and then finish with a more intuitive way to think about its true value that goes beyond the usual models.
SoFi Technologies scores just 0/6 on our valuation checks. See what other red flags we found in the full valuation breakdown.
Approach 1: SoFi Technologies Excess Returns Analysis
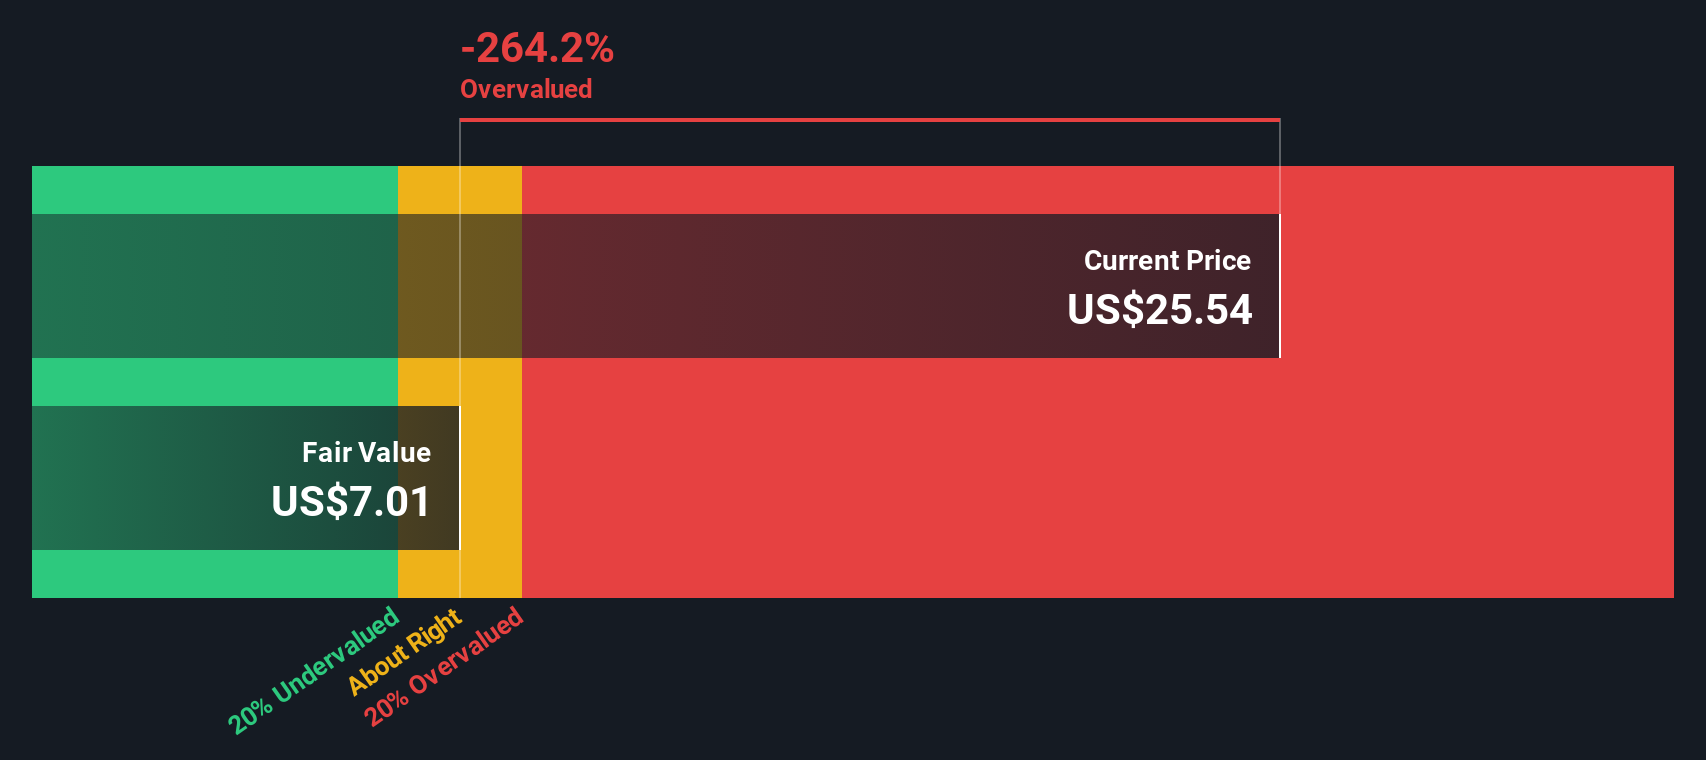
The Excess Returns model asks a simple question: how much profit can SoFi generate above the return that shareholders reasonably demand on their equity, and for how long can that continue? It starts from the company’s book value and projects earnings based on expected returns on equity, then values the stream of profits that exceed the required cost of equity.
For SoFi, the model uses a Book Value of $7.29 per share and a Stable EPS of $0.70 per share, based on weighted future return on equity estimates from 5 analysts. The implied Cost of Equity is $0.62 per share, which leaves an Excess Return of just $0.09 per share. That is underpinned by an Average Return on Equity of 9.14% and a Stable Book Value estimate of $7.68 per share from 7 analysts.
When these modest excess returns are projected forward and discounted, the Excess Returns model arrives at a fair value that sits well below the current share price, implying the stock is roughly 188.0% overvalued today.
Result: OVERVALUED
Our Excess Returns analysis suggests SoFi Technologies may be overvalued by 188.0%. Discover 907 undervalued stocks or create your own screener to find better value opportunities.
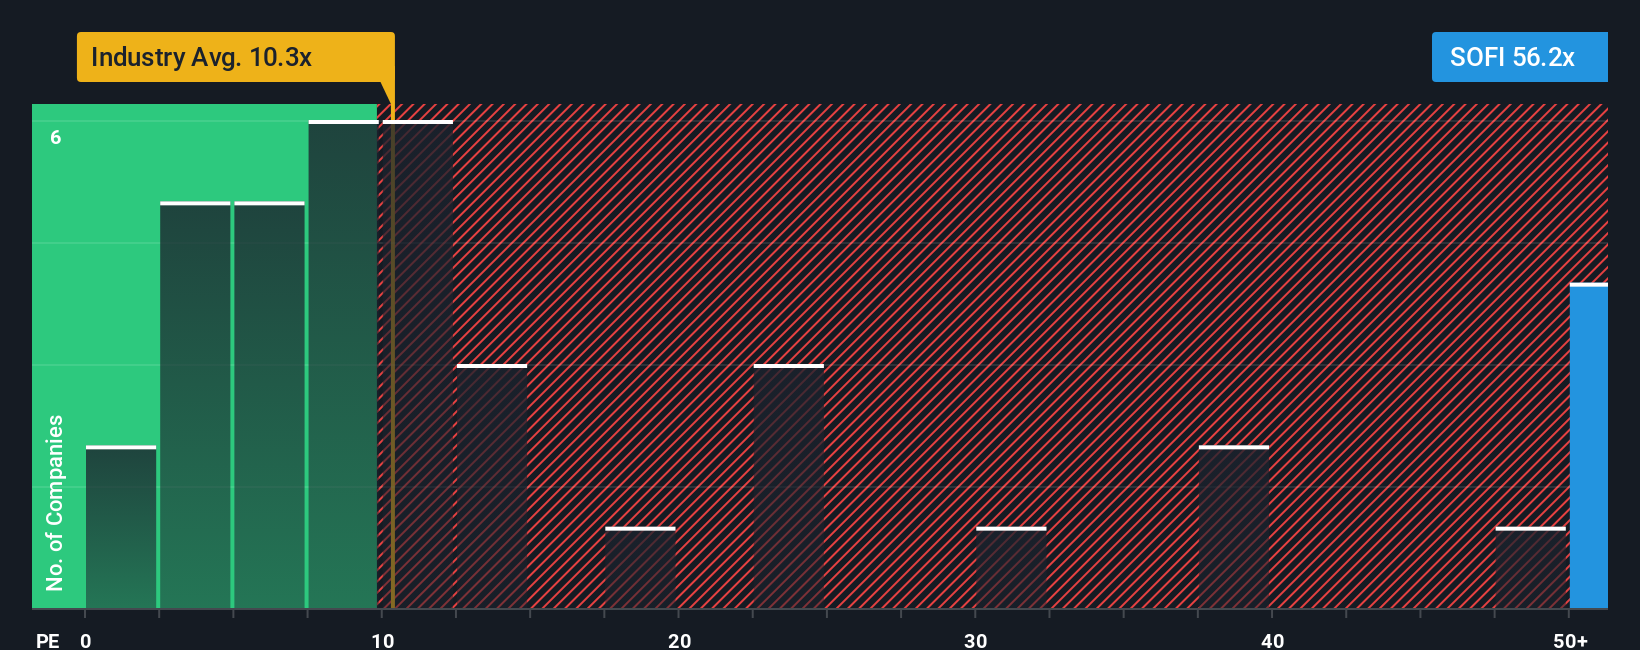
Approach 2: SoFi Technologies Price vs Earnings
For a company that has moved into consistent profitability, the price to earnings ratio is a useful yardstick because it ties the share price directly to the earnings that ultimately support longer term returns. Higher growth and lower perceived risk usually justify a higher PE, while slower growth or greater uncertainty call for a lower, more conservative multiple.
SoFi currently trades on a PE of 53.7x, which is far richer than both the Consumer Finance industry average of 9.5x and the broader peer group average of 16.4x. To get beyond these blunt comparisons, Simply Wall St calculates a Fair Ratio, the PE multiple that would be reasonable given SoFi’s specific mix of growth prospects, profitability profile, industry, size, and risk factors.
On this basis, SoFi’s Fair Ratio comes out at 26.3x, which is well below the current 53.7x. Because this metric already adjusts for SoFi’s stronger growth and higher risk, it provides a more nuanced benchmark than simple industry or peer averages and still suggests investors are paying a substantial premium for the story today.
Result: OVERVALUED
PE ratios tell one story, but what if the real opportunity lies elsewhere? Discover 1448 companies where insiders are betting big on explosive growth.
Upgrade Your Decision Making: Choose your SoFi Technologies Narrative
Earlier we mentioned that there is an even better way to understand valuation, so let us introduce you to Narratives, a simple way to connect your view of SoFi’s story with the numbers behind its future.
A Narrative is your own, clearly stated perspective on a company, where you spell out what you think will happen to its revenue, earnings, and margins, and then link that story to a fair value estimate rather than relying only on standard models or headline multiples.
On Simply Wall St’s Community page, used by millions of investors, Narratives turn this into an easy, guided process, helping you build a forecast, convert it into a fair value, and then compare that fair value to today’s share price so you can decide whether SoFi is a buy, hold, or sell.
Because Narratives update dynamically when new earnings, news, or guidance are released, they stay current and can reflect very different perspectives. For example, one SoFi Narrative might see fair value closer to $14, while another, more optimistic view might see something nearer to $27. The platform lets you transparently compare these stories side by side.
Do you think there's more to the story for SoFi Technologies? Head over to our Community to see what others are saying!
This article by Simply Wall St is general in nature. We provide commentary based on historical data and analyst forecasts only using an unbiased methodology and our articles are not intended to be financial advice. It does not constitute a recommendation to buy or sell any stock, and does not take account of your objectives, or your financial situation. We aim to bring you long-term focused analysis driven by fundamental data. Note that our analysis may not factor in the latest price-sensitive company announcements or qualitative material. Simply Wall St has no position in any stocks mentioned.
Have feedback on this article? Concerned about the content? Get in touch with us directly. Alternatively, email editorial-team@simplywallst.com