
- LIVE QUOTES
- LEARN
- HELP
 Nasdaq
 Wall Street Journal
EN
Venus Remedies Limited's (NSE:VENUSREM) market cap rose ₹1.1b last week; retail investors who hold 47% profited and so did insiders
Key Insights
- The considerable ownership by retail investors in Venus Remedies indicates that they collectively have a greater say in management and business strategy
- A total of 8 investors have a majority stake in the company with 51% ownership
- Insider ownership in Venus Remedies is 30%
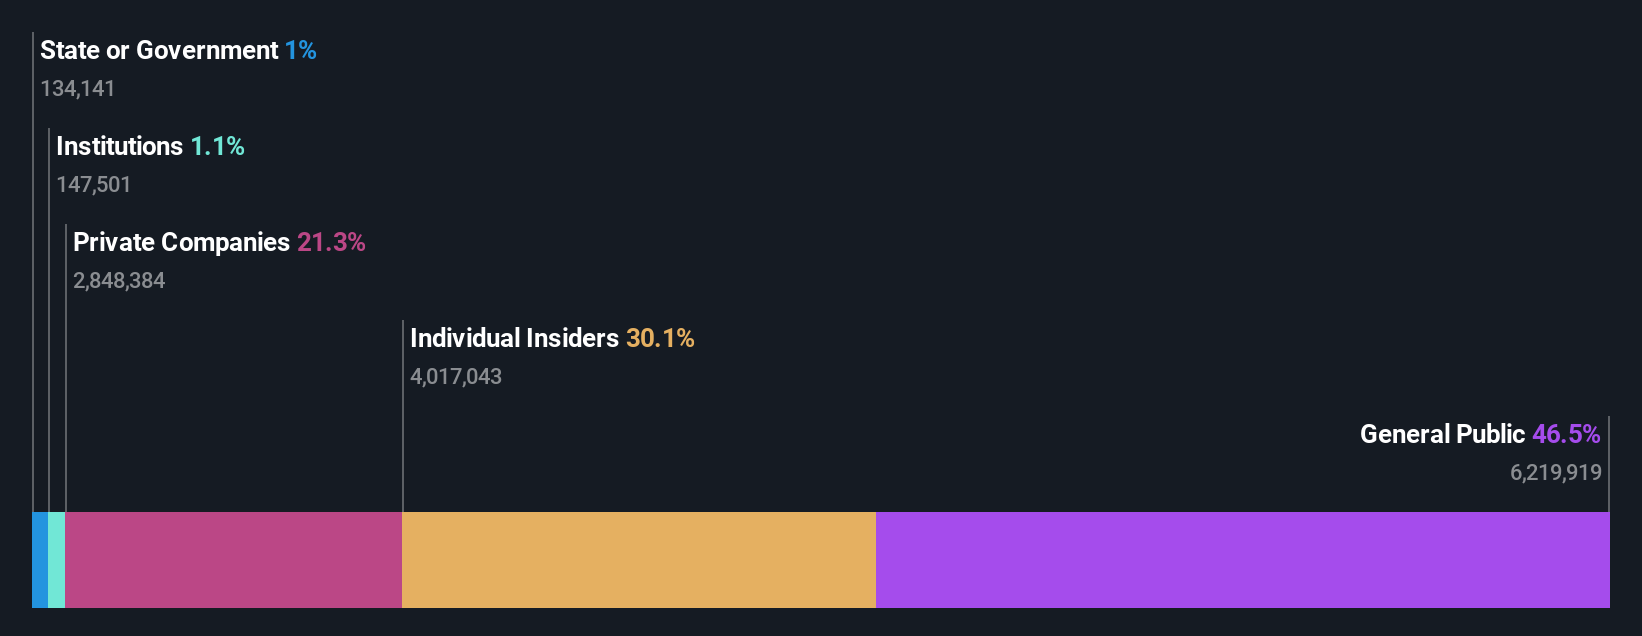
To get a sense of who is truly in control of Venus Remedies Limited (NSE:VENUSREM), it is important to understand the ownership structure of the business. We can see that retail investors own the lion's share in the company with 47% ownership. Put another way, the group faces the maximum upside potential (or downside risk).
Retail investors gained the most after market cap touched ₹11b last week, while insiders who own 30% also benefitted.
In the chart below, we zoom in on the different ownership groups of Venus Remedies.
See our latest analysis for Venus Remedies
What Does The Institutional Ownership Tell Us About Venus Remedies?
Many institutions measure their performance against an index that approximates the local market. So they usually pay more attention to companies that are included in major indices.
Institutions have a very small stake in Venus Remedies. That indicates that the company is on the radar of some funds, but it isn't particularly popular with professional investors at the moment. So if the company itself can improve over time, we may well see more institutional buyers in the future. When multiple institutional investors want to buy shares, we often see a rising share price. The past revenue trajectory (shown below) can be an indication of future growth, but there are no guarantees.

We note that hedge funds don't have a meaningful investment in Venus Remedies. The company's largest shareholder is Sunev Pharma Solutions Ltd, with ownership of 17%. Meanwhile, the second and third largest shareholders, hold 13% and 12%, of the shares outstanding, respectively. Interestingly, the bottom two of the top three shareholders also hold the title of Chief Financial Officer and Member of the Board of Directors, respectively, suggesting that these insiders have a personal stake in the company.
We did some more digging and found that 8 of the top shareholders account for roughly 51% of the register, implying that along with larger shareholders, there are a few smaller shareholders, thereby balancing out each others interests somewhat.
Researching institutional ownership is a good way to gauge and filter a stock's expected performance. The same can be achieved by studying analyst sentiments. We're not picking up on any analyst coverage of the stock at the moment, so the company is unlikely to be widely held.
Insider Ownership Of Venus Remedies
The definition of company insiders can be subjective and does vary between jurisdictions. Our data reflects individual insiders, capturing board members at the very least. The company management answer to the board and the latter should represent the interests of shareholders. Notably, sometimes top-level managers are on the board themselves.
I generally consider insider ownership to be a good thing. However, on some occasions it makes it more difficult for other shareholders to hold the board accountable for decisions.
Our information suggests that insiders maintain a significant holding in Venus Remedies Limited. It has a market capitalization of just ₹11b, and insiders have ₹3.3b worth of shares in their own names. This may suggest that the founders still own a lot of shares. You can click here to see if they have been buying or selling.
General Public Ownership
With a 47% ownership, the general public, mostly comprising of individual investors, have some degree of sway over Venus Remedies. This size of ownership, while considerable, may not be enough to change company policy if the decision is not in sync with other large shareholders.
Private Company Ownership
We can see that Private Companies own 21%, of the shares on issue. It might be worth looking deeper into this. If related parties, such as insiders, have an interest in one of these private companies, that should be disclosed in the annual report. Private companies may also have a strategic interest in the company.
Next Steps:
It's always worth thinking about the different groups who own shares in a company. But to understand Venus Remedies better, we need to consider many other factors. Be aware that Venus Remedies is showing 2 warning signs in our investment analysis , and 1 of those doesn't sit too well with us...
Of course, you might find a fantastic investment by looking elsewhere. So take a peek at this free list of interesting companies.
NB: Figures in this article are calculated using data from the last twelve months, which refer to the 12-month period ending on the last date of the month the financial statement is dated. This may not be consistent with full year annual report figures.
Have feedback on this article? Concerned about the content? Get in touch with us directly. Alternatively, email editorial-team (at) simplywallst.com.
This article by Simply Wall St is general in nature. We provide commentary based on historical data and analyst forecasts only using an unbiased methodology and our articles are not intended to be financial advice. It does not constitute a recommendation to buy or sell any stock, and does not take account of your objectives, or your financial situation. We aim to bring you long-term focused analysis driven by fundamental data. Note that our analysis may not factor in the latest price-sensitive company announcements or qualitative material. Simply Wall St has no position in any stocks mentioned.