
- LIVE QUOTES
- LEARN
- HELP
 Nasdaq
 Wall Street Journal
EN
Kaynes Technology India (NSE:KAYNES) Has A Pretty Healthy Balance Sheet
Howard Marks put it nicely when he said that, rather than worrying about share price volatility, 'The possibility of permanent loss is the risk I worry about... and every practical investor I know worries about.' When we think about how risky a company is, we always like to look at its use of debt, since debt overload can lead to ruin. Importantly, Kaynes Technology India Limited (NSE:KAYNES) does carry debt. But the more important question is: how much risk is that debt creating?
Why Does Debt Bring Risk?
Debt is a tool to help businesses grow, but if a business is incapable of paying off its lenders, then it exists at their mercy. If things get really bad, the lenders can take control of the business. While that is not too common, we often do see indebted companies permanently diluting shareholders because lenders force them to raise capital at a distressed price. Having said that, the most common situation is where a company manages its debt reasonably well - and to its own advantage. The first step when considering a company's debt levels is to consider its cash and debt together.
What Is Kaynes Technology India's Net Debt?
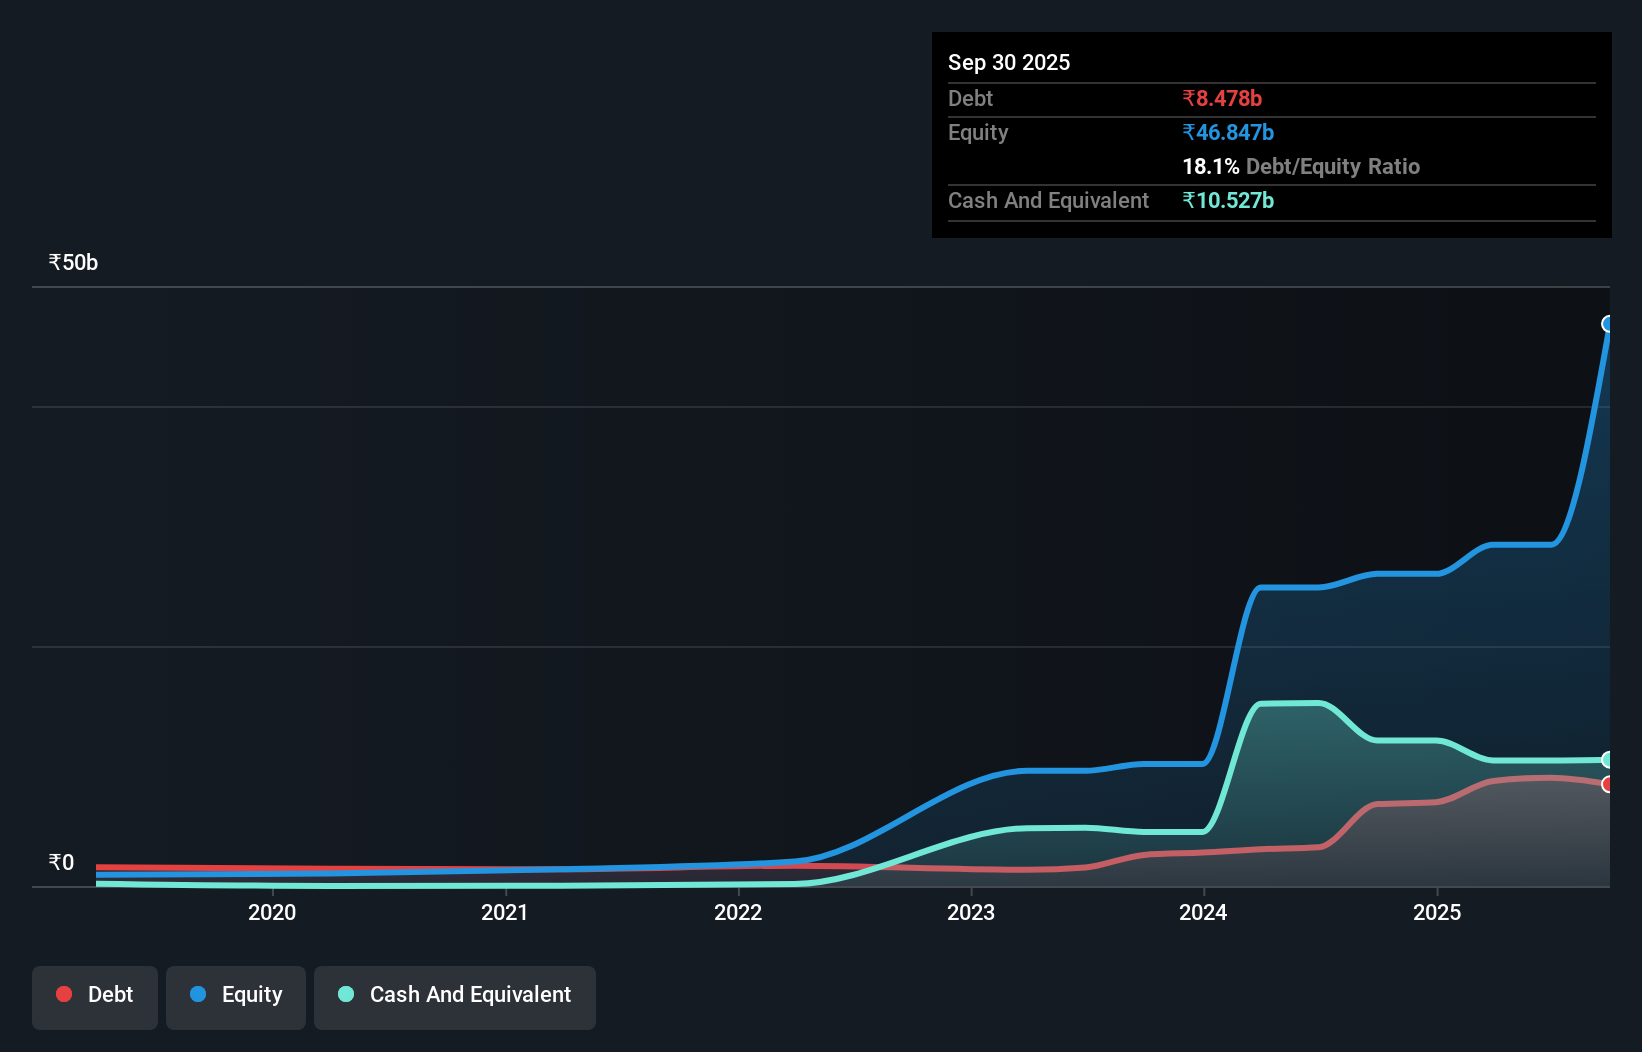
The image below, which you can click on for greater detail, shows that at September 2025 Kaynes Technology India had debt of ₹8.48b, up from ₹6.83b in one year. But on the other hand it also has ₹10.5b in cash, leading to a ₹2.05b net cash position.
How Strong Is Kaynes Technology India's Balance Sheet?
We can see from the most recent balance sheet that Kaynes Technology India had liabilities of ₹16.9b falling due within a year, and liabilities of ₹3.59b due beyond that. On the other hand, it had cash of ₹10.5b and ₹11.7b worth of receivables due within a year. So it can boast ₹1.73b more liquid assets than total liabilities.
This state of affairs indicates that Kaynes Technology India's balance sheet looks quite solid, as its total liabilities are just about equal to its liquid assets. So it's very unlikely that the ₹285.9b company is short on cash, but still worth keeping an eye on the balance sheet. Succinctly put, Kaynes Technology India boasts net cash, so it's fair to say it does not have a heavy debt load!
View our latest analysis for Kaynes Technology India
In addition to that, we're happy to report that Kaynes Technology India has boosted its EBIT by 63%, thus reducing the spectre of future debt repayments. The balance sheet is clearly the area to focus on when you are analysing debt. But it is future earnings, more than anything, that will determine Kaynes Technology India's ability to maintain a healthy balance sheet going forward. So if you're focused on the future you can check out this free report showing analyst profit forecasts.
Finally, a business needs free cash flow to pay off debt; accounting profits just don't cut it. While Kaynes Technology India has net cash on its balance sheet, it's still worth taking a look at its ability to convert earnings before interest and tax (EBIT) to free cash flow, to help us understand how quickly it is building (or eroding) that cash balance. Over the last three years, Kaynes Technology India saw substantial negative free cash flow, in total. While investors are no doubt expecting a reversal of that situation in due course, it clearly does mean its use of debt is more risky.
Summing Up
While it is always sensible to investigate a company's debt, in this case Kaynes Technology India has ₹2.05b in net cash and a decent-looking balance sheet. And we liked the look of last year's 63% year-on-year EBIT growth. So we are not troubled with Kaynes Technology India's debt use. There's no doubt that we learn most about debt from the balance sheet. But ultimately, every company can contain risks that exist outside of the balance sheet. Case in point: We've spotted 2 warning signs for Kaynes Technology India you should be aware of, and 1 of them is potentially serious.
When all is said and done, sometimes its easier to focus on companies that don't even need debt. Readers can access a list of growth stocks with zero net debt 100% free, right now.
Have feedback on this article? Concerned about the content? Get in touch with us directly. Alternatively, email editorial-team (at) simplywallst.com.
This article by Simply Wall St is general in nature. We provide commentary based on historical data and analyst forecasts only using an unbiased methodology and our articles are not intended to be financial advice. It does not constitute a recommendation to buy or sell any stock, and does not take account of your objectives, or your financial situation. We aim to bring you long-term focused analysis driven by fundamental data. Note that our analysis may not factor in the latest price-sensitive company announcements or qualitative material. Simply Wall St has no position in any stocks mentioned.