
- LIVE QUOTES
- LEARN
- HELP
 Nasdaq
 Wall Street Journal
EN
Fletcher Building (NZSE:FBU): Valuation Check After Major Balance Sheet Restructuring and Liquidity Boost
Fletcher Building (NZSE:FBU) just took a big step in its clean up job on the balance sheet by exiting its US private placement debt, adding fresh bank lines, and extending key covenants to keep liquidity comfortable.
See our latest analysis for Fletcher Building.
Those balance sheet moves seem to be resonating with investors, with a roughly 20 percent 3 month share price return and a 1 year total shareholder return near 28 percent, which suggests momentum is rebuilding after a tough few years.
If this kind of balance sheet reset has you thinking about where else capital could work harder, now is a good time to explore fast growing stocks with high insider ownership.
Yet even after this clean up and a share price rebound, Fletcher Building still trades at a deep discount to some intrinsic value estimates. So is this a contrarian entry point, or is the market already banking on a full earnings recovery?
Price-to-Sales of 0.6x: Is it justified?
On a price-to-sales basis, Fletcher Building at NZ$3.66 looks inexpensive versus peers, which hints that the market is not paying up for its revenue base.
The price-to-sales ratio compares the company’s market value with the revenue it generates. This can be a useful lens for cyclical or currently loss-making industrials where earnings are volatile or negative. For a diversified building products and construction group like Fletcher Building, it helps investors gauge how much they are paying for each dollar of sales across its New Zealand and Australian operations.
Fletcher Building trades on a price-to-sales ratio of 0.6 times. Management and investors will note that this is flagged as good value versus both peers and the wider building industry. The stock also screens as good value against an estimated fair price-to-sales level of 1 times, which implies room for the market to re-rate closer to that benchmark if the expected profit turnaround materialises.
Compared with the global building industry average of 1 times sales and a peer average of 1.6 times, Fletcher Building’s 0.6 times multiple represents a steep discount and suggests investors remain cautious about its earnings recovery. If sentiment improves and fundamentals move in line with forecasts, there is scope for the multiple to converge toward the estimated fair price-to-sales ratio level, which could close a meaningful part of that valuation gap.
Explore the SWS fair ratio for Fletcher Building
Result: Price-to-sales of 0.6x (UNDERVALUED)
However, lingering losses and a share price already above analyst targets mean that any earnings setback or softer construction demand could quickly puncture the recovery story.
Find out about the key risks to this Fletcher Building narrative.
Another View: Our DCF Fair Value
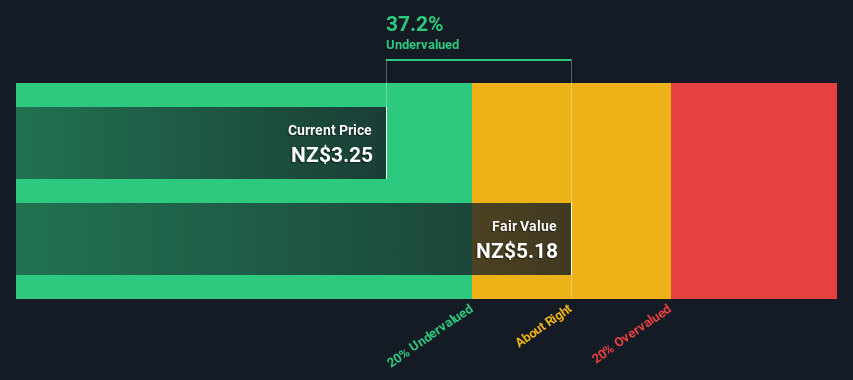
Our DCF model paints an even starker picture, suggesting Fletcher Building’s fair value sits around NZ$10.76, roughly 66 percent above the current NZ$3.66 share price. If cash flows normalise as forecast, is the market still underpricing a full repair in earnings power?
Look into how the SWS DCF model arrives at its fair value.
Simply Wall St performs a discounted cash flow (DCF) on every stock in the world every day (check out Fletcher Building for example). We show the entire calculation in full. You can track the result in your watchlist or portfolio and be alerted when this changes, or use our stock screener to discover 904 undervalued stocks based on their cash flows. If you save a screener we even alert you when new companies match - so you never miss a potential opportunity.
Build Your Own Fletcher Building Narrative
If you see things differently or want to dig into the numbers yourself, you can quickly craft a personalised view in just a few minutes: Do it your way.
A good starting point is our analysis highlighting 3 key rewards investors are optimistic about regarding Fletcher Building.
Ready for your next investment move?
Do not stop with just one stock. Use the Simply Wall St Screener to pinpoint fresh opportunities and stay ahead while others wait on the sidelines.
- Capture potential mispricings early by scanning these 904 undervalued stocks based on cash flows that may still be trading below their long term cash flow power.
- Fuel your growth strategy by targeting these 26 AI penny stocks positioned to benefit from accelerating demand for artificial intelligence solutions.
- Boost your income stream by focusing on these 12 dividend stocks with yields > 3% that can enhance portfolio yield without abandoning quality.
This article by Simply Wall St is general in nature. We provide commentary based on historical data and analyst forecasts only using an unbiased methodology and our articles are not intended to be financial advice. It does not constitute a recommendation to buy or sell any stock, and does not take account of your objectives, or your financial situation. We aim to bring you long-term focused analysis driven by fundamental data. Note that our analysis may not factor in the latest price-sensitive company announcements or qualitative material. Simply Wall St has no position in any stocks mentioned.
Have feedback on this article? Concerned about the content? Get in touch with us directly. Alternatively, email editorial-team@simplywallst.com