
- LIVE QUOTES
- LEARN
- HELP
 Nasdaq
 Wall Street Journal
EN
Is Occidental Petroleum Attractively Priced After 17.3% Year To Date Share Price Drop?
- If you are wondering whether Occidental Petroleum is a bargain or a value trap at current levels, this breakdown will walk you through what the numbers are really saying about the stock.
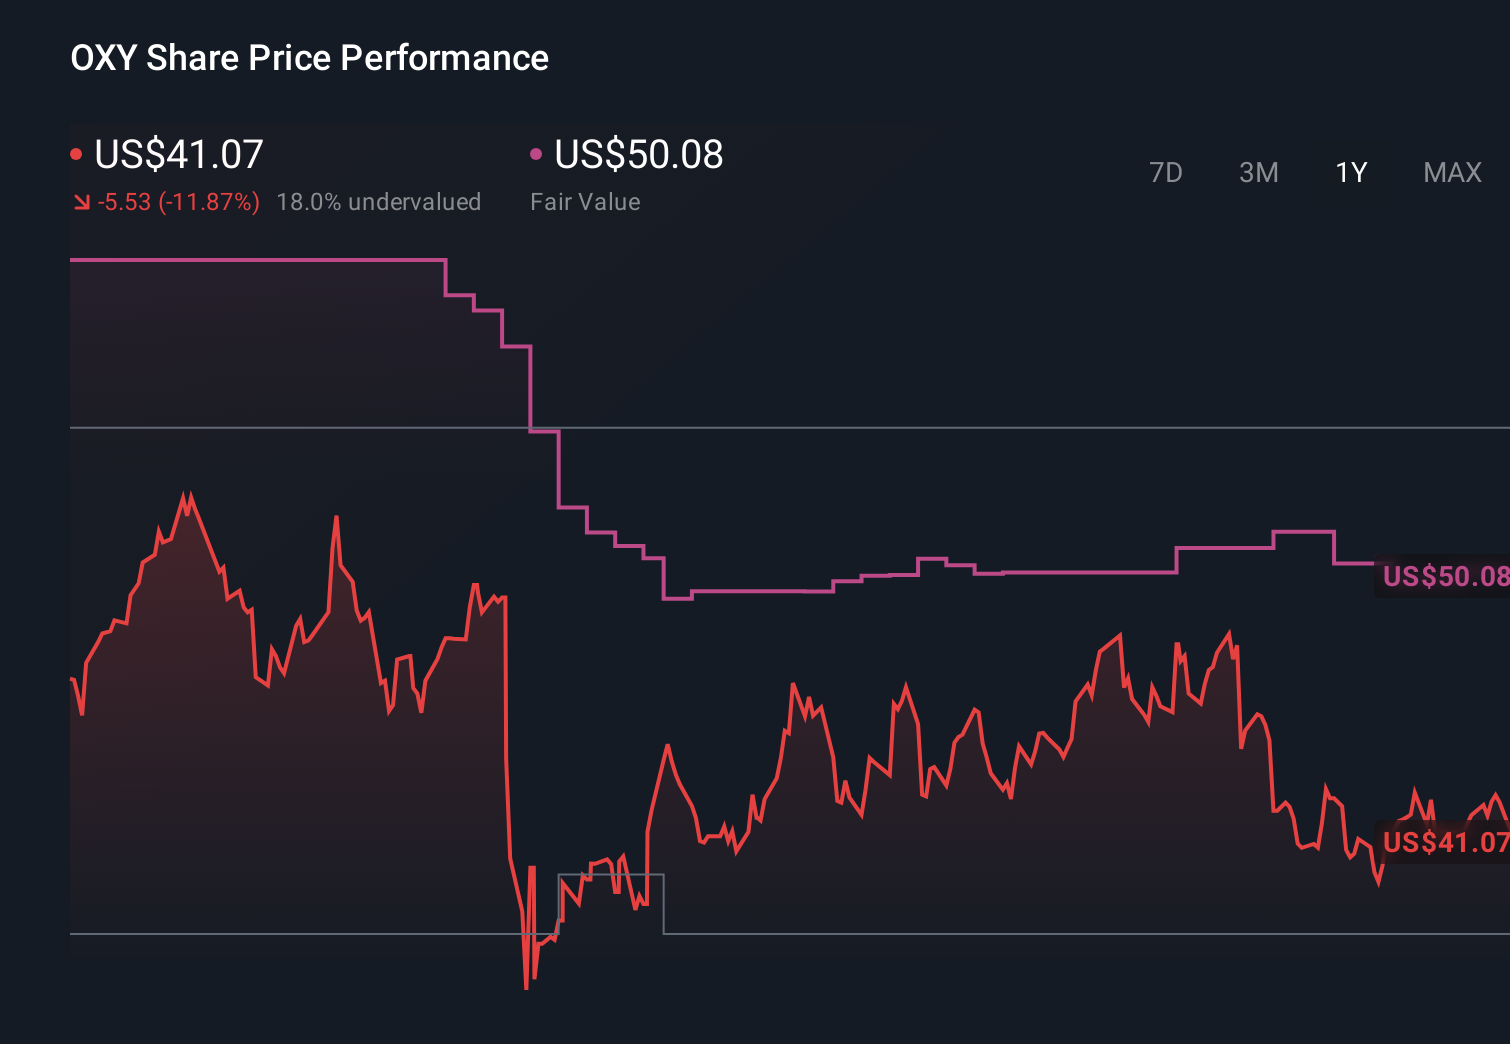
- The share price has slipped recently, down 3.4% over the past week, 1.6% over the last month and 17.3% year to date, while longer term 5 year holders are still sitting on a 128.0% gain.
- Those moves are happening against a backdrop of ongoing energy market volatility, shifting expectations for interest rates, and renewed attention on US shale producers as investors reassess long term oil demand. Occidental has also stayed in the spotlight thanks to its large stake from Berkshire Hathaway and its continued investments in low carbon and carbon capture projects, which some see as important to its long term relevance.
- On our simple valuation checks, Occidental scores just 2/6. In the sections that follow we will explore how different valuation approaches view the stock, and then finish by looking at a more comprehensive way to understand its worth beyond any single metric.
Occidental Petroleum scores just 2/6 on our valuation checks. See what other red flags we found in the full valuation breakdown.
Approach 1: Occidental Petroleum Discounted Cash Flow (DCF) Analysis
A Discounted Cash Flow model estimates what a business is worth today by projecting its future cash flows and discounting them back into current dollars. For Occidental Petroleum, the model uses a 2 Stage Free Cash Flow to Equity approach built on cash flow projections rather than earnings.
Occidental generated about $4.4 billion of free cash flow over the last twelve months, and analysts plus extrapolated estimates see this rising to around $6.6 billion by 2026, with projections stepping up to roughly $12.5 billion by 2035. Simply Wall St discounts these cash flows to reflect risk and the time value of money, then adds them together to get an estimated intrinsic value per share.
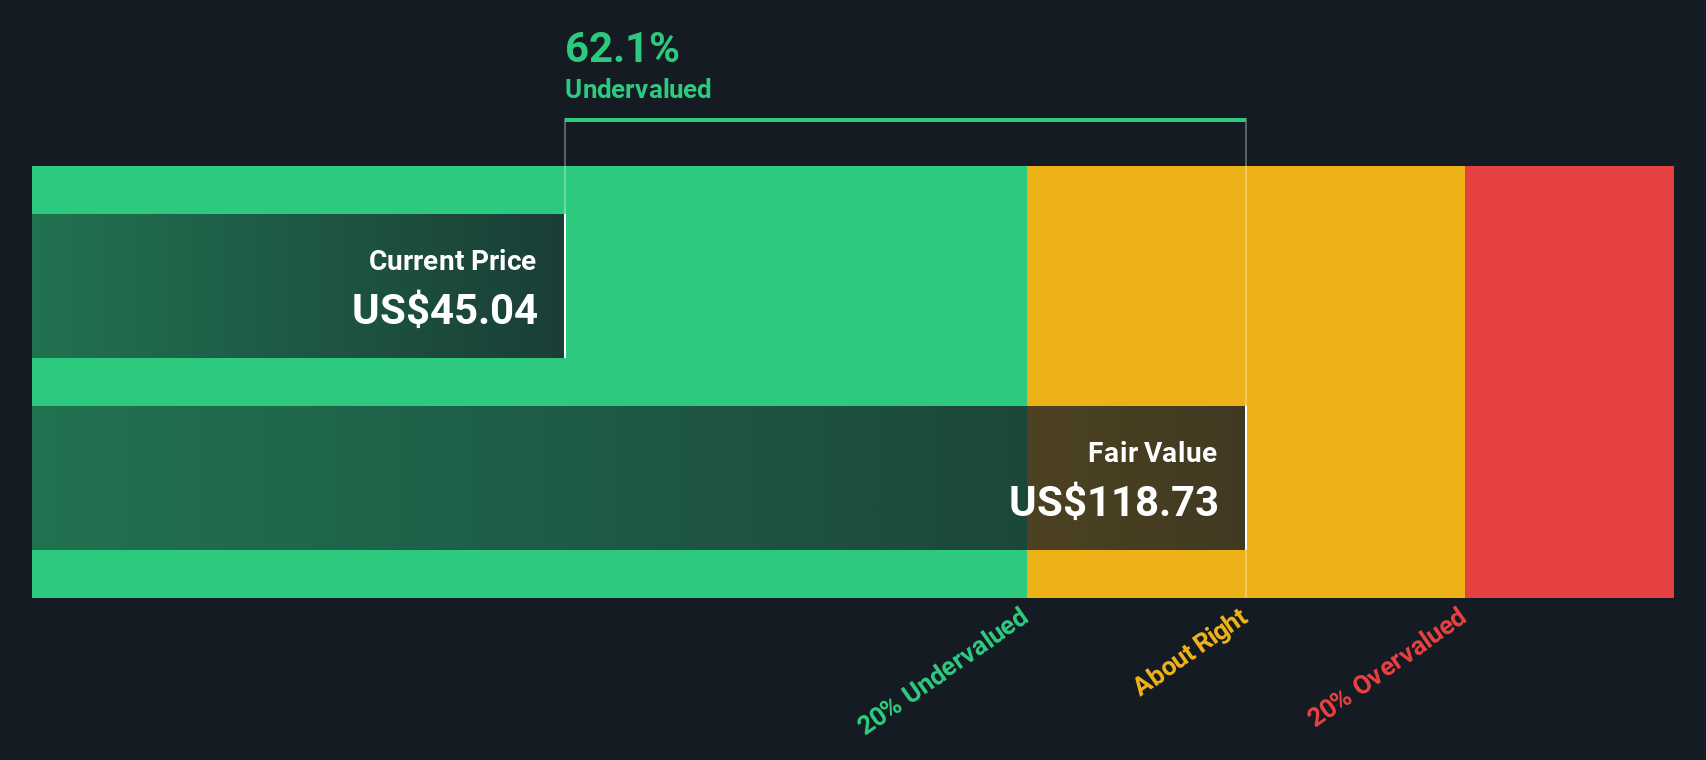
On this basis, the DCF indicates a fair value of about $236.09 per share. At that level, the stock would be trading at roughly an 82.5% discount to its calculated worth according to this model. That suggests the market is pricing in much weaker or riskier cash flows than this model assumes.
Result: UNDERVALUED
Our Discounted Cash Flow (DCF) analysis suggests Occidental Petroleum is undervalued by 82.5%. Track this in your watchlist or portfolio, or discover 904 more undervalued stocks based on cash flows.
Approach 2: Occidental Petroleum Price vs Earnings
For a profitable company like Occidental Petroleum, the price to earnings ratio is a useful yardstick because it directly links what investors are paying for each share to the earnings the business is currently generating. In general, companies with stronger, more reliable growth and lower perceived risk can justify a higher PE ratio, while slower growing or riskier firms usually deserve a lower multiple.
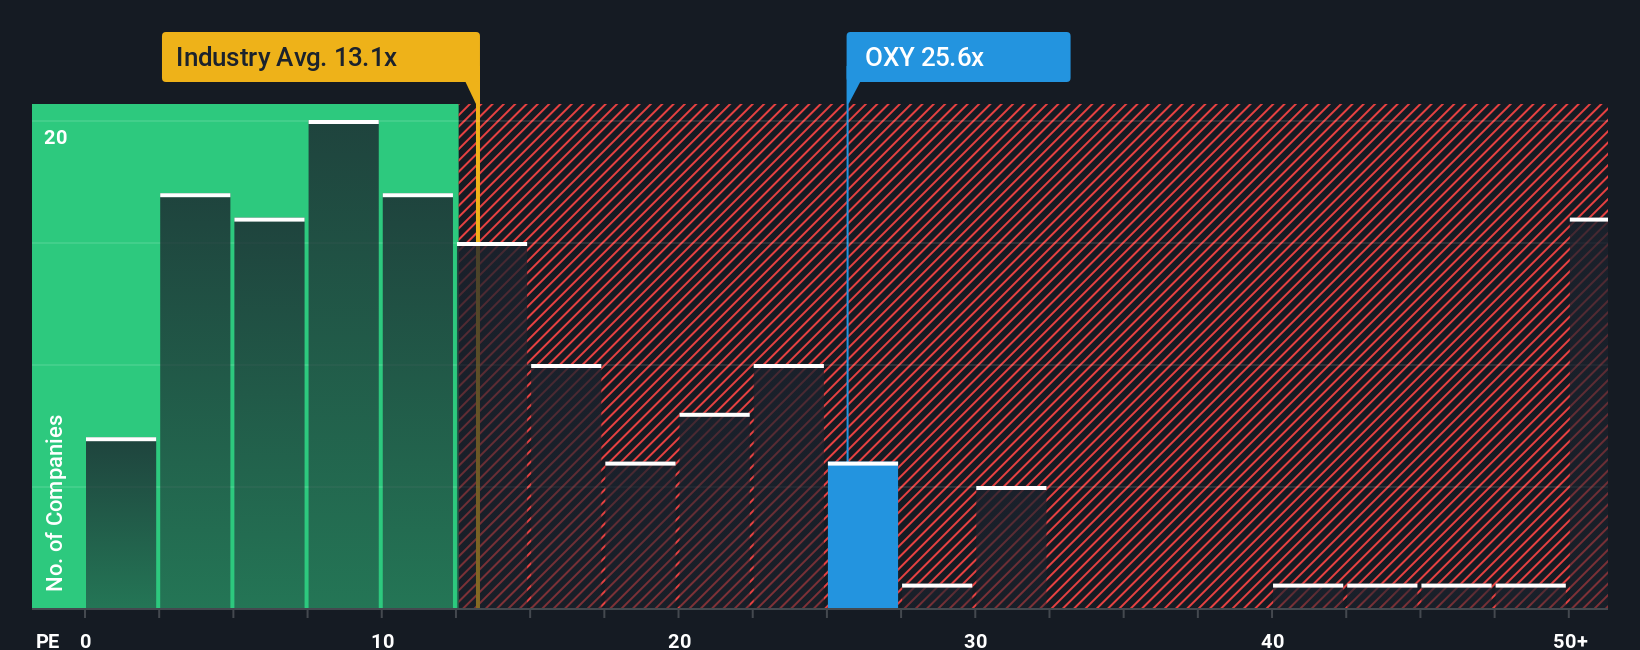
Occidental is trading on a PE of about 27.8x, which is notably higher than both the Oil and Gas industry average of roughly 13.5x and the broader peer group average of about 25.1x. To go a step further than simple comparisons, Simply Wall St also calculates a proprietary Fair Ratio for each company. This is the PE multiple that would be expected given Occidental’s specific earnings growth outlook, profitability, size, industry positioning and risk profile.
For Occidental, that Fair Ratio sits at around 20.0x, which is below the current market multiple. Because the actual PE is meaningfully higher than this Fair Ratio, the shares look somewhat stretched on an earnings basis.
Result: OVERVALUED
PE ratios tell one story, but what if the real opportunity lies elsewhere? Discover 1446 companies where insiders are betting big on explosive growth.
Upgrade Your Decision Making: Choose your Occidental Petroleum Narrative
Earlier we mentioned that there is an even better way to understand valuation, so let us introduce you to Narratives, a simple way to attach your story about a company to the numbers you think are realistic for its future revenue, earnings, margins and fair value. A Narrative on Simply Wall St links three things together: the business story you believe, the financial forecast that flows from that story, and the fair value that those cash flows imply, all in one place on the Community page that millions of investors use. With Narratives, you can quickly see whether your view of Occidental’s fair value is above or below today’s share price and decide if that means buy, hold or sell for you, then watch that view update dynamically as fresh news, earnings and guidance are incorporated. For Occidental, one investor might build a bullish Narrative around successful carbon capture, steady oil demand and rising margins that supports a fair value near the top of the current community range, while a more cautious investor might assume weaker oil prices, slower CCS adoption and tighter margins, landing on a fair value closer to the low 40s.
Do you think there's more to the story for Occidental Petroleum? Head over to our Community to see what others are saying!
This article by Simply Wall St is general in nature. We provide commentary based on historical data and analyst forecasts only using an unbiased methodology and our articles are not intended to be financial advice. It does not constitute a recommendation to buy or sell any stock, and does not take account of your objectives, or your financial situation. We aim to bring you long-term focused analysis driven by fundamental data. Note that our analysis may not factor in the latest price-sensitive company announcements or qualitative material. Simply Wall St has no position in any stocks mentioned.
Have feedback on this article? Concerned about the content? Get in touch with us directly. Alternatively, email editorial-team@simplywallst.com