
- LIVE QUOTES
- LEARN
- HELP
 Nasdaq
 Wall Street Journal
EN
Amot Investments (TLV:AMOT) Has A Pretty Healthy Balance Sheet
Warren Buffett famously said, 'Volatility is far from synonymous with risk.' It's only natural to consider a company's balance sheet when you examine how risky it is, since debt is often involved when a business collapses. Importantly, Amot Investments Ltd. (TLV:AMOT) does carry debt. But the more important question is: how much risk is that debt creating?
Why Does Debt Bring Risk?
Generally speaking, debt only becomes a real problem when a company can't easily pay it off, either by raising capital or with its own cash flow. If things get really bad, the lenders can take control of the business. While that is not too common, we often do see indebted companies permanently diluting shareholders because lenders force them to raise capital at a distressed price. Having said that, the most common situation is where a company manages its debt reasonably well - and to its own advantage. When we examine debt levels, we first consider both cash and debt levels, together.
How Much Debt Does Amot Investments Carry?
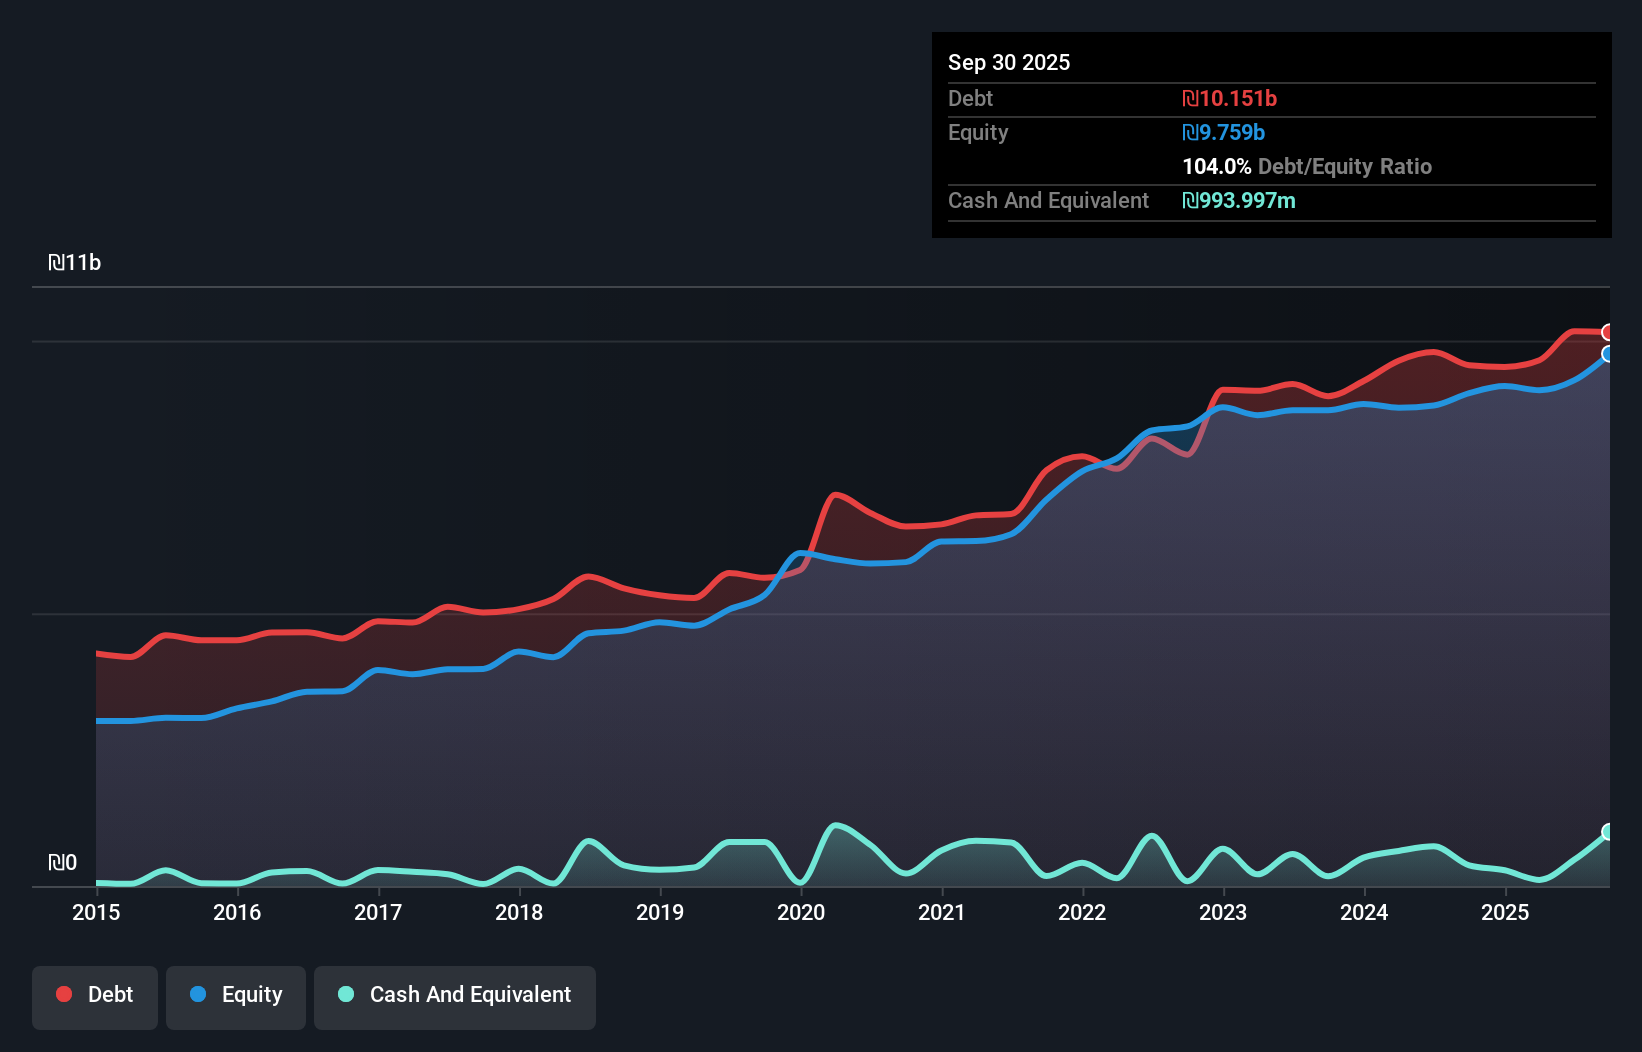
The image below, which you can click on for greater detail, shows that at September 2025 Amot Investments had debt of ₪10.2b, up from ₪9.55b in one year. However, it does have ₪994.0m in cash offsetting this, leading to net debt of about ₪9.16b.
How Healthy Is Amot Investments' Balance Sheet?
Zooming in on the latest balance sheet data, we can see that Amot Investments had liabilities of ₪947.2m due within 12 months and liabilities of ₪11.4b due beyond that. Offsetting these obligations, it had cash of ₪994.0m as well as receivables valued at ₪75.0m due within 12 months. So its liabilities outweigh the sum of its cash and (near-term) receivables by ₪11.3b.
This is a mountain of leverage relative to its market capitalization of ₪12.2b. Should its lenders demand that it shore up the balance sheet, shareholders would likely face severe dilution.
See our latest analysis for Amot Investments
We use two main ratios to inform us about debt levels relative to earnings. The first is net debt divided by earnings before interest, tax, depreciation, and amortization (EBITDA), while the second is how many times its earnings before interest and tax (EBIT) covers its interest expense (or its interest cover, for short). The advantage of this approach is that we take into account both the absolute quantum of debt (with net debt to EBITDA) and the actual interest expenses associated with that debt (with its interest cover ratio).
Strangely Amot Investments has a sky high EBITDA ratio of 9.7, implying high debt, but a strong interest coverage of 17.2. This means that unless the company has access to very cheap debt, that interest expense will likely grow in the future. Amot Investments grew its EBIT by 4.1% in the last year. Whilst that hardly knocks our socks off it is a positive when it comes to debt. The balance sheet is clearly the area to focus on when you are analysing debt. But you can't view debt in total isolation; since Amot Investments will need earnings to service that debt. So if you're keen to discover more about its earnings, it might be worth checking out this graph of its long term earnings trend.
But our final consideration is also important, because a company cannot pay debt with paper profits; it needs cold hard cash. So we clearly need to look at whether that EBIT is leading to corresponding free cash flow. Over the last three years, Amot Investments recorded free cash flow worth a fulsome 90% of its EBIT, which is stronger than we'd usually expect. That puts it in a very strong position to pay down debt.
Our View
Based on what we've seen Amot Investments is not finding it easy, given its net debt to EBITDA, but the other factors we considered give us cause to be optimistic. In particular, we are dazzled with its interest cover. Looking at all this data makes us feel a little cautious about Amot Investments's debt levels. While we appreciate debt can enhance returns on equity, we'd suggest that shareholders keep close watch on its debt levels, lest they increase. The balance sheet is clearly the area to focus on when you are analysing debt. But ultimately, every company can contain risks that exist outside of the balance sheet. Be aware that Amot Investments is showing 3 warning signs in our investment analysis , and 1 of those is a bit concerning...
Of course, if you're the type of investor who prefers buying stocks without the burden of debt, then don't hesitate to discover our exclusive list of net cash growth stocks, today.
Have feedback on this article? Concerned about the content? Get in touch with us directly. Alternatively, email editorial-team (at) simplywallst.com.
This article by Simply Wall St is general in nature. We provide commentary based on historical data and analyst forecasts only using an unbiased methodology and our articles are not intended to be financial advice. It does not constitute a recommendation to buy or sell any stock, and does not take account of your objectives, or your financial situation. We aim to bring you long-term focused analysis driven by fundamental data. Note that our analysis may not factor in the latest price-sensitive company announcements or qualitative material. Simply Wall St has no position in any stocks mentioned.