
- LIVE QUOTES
- LEARN
- HELP
 Nasdaq
 Wall Street Journal
EN
Are Investors Undervaluing Oxford Innotech Berhad (KLSE:OXB) By 35%?
Key Insights
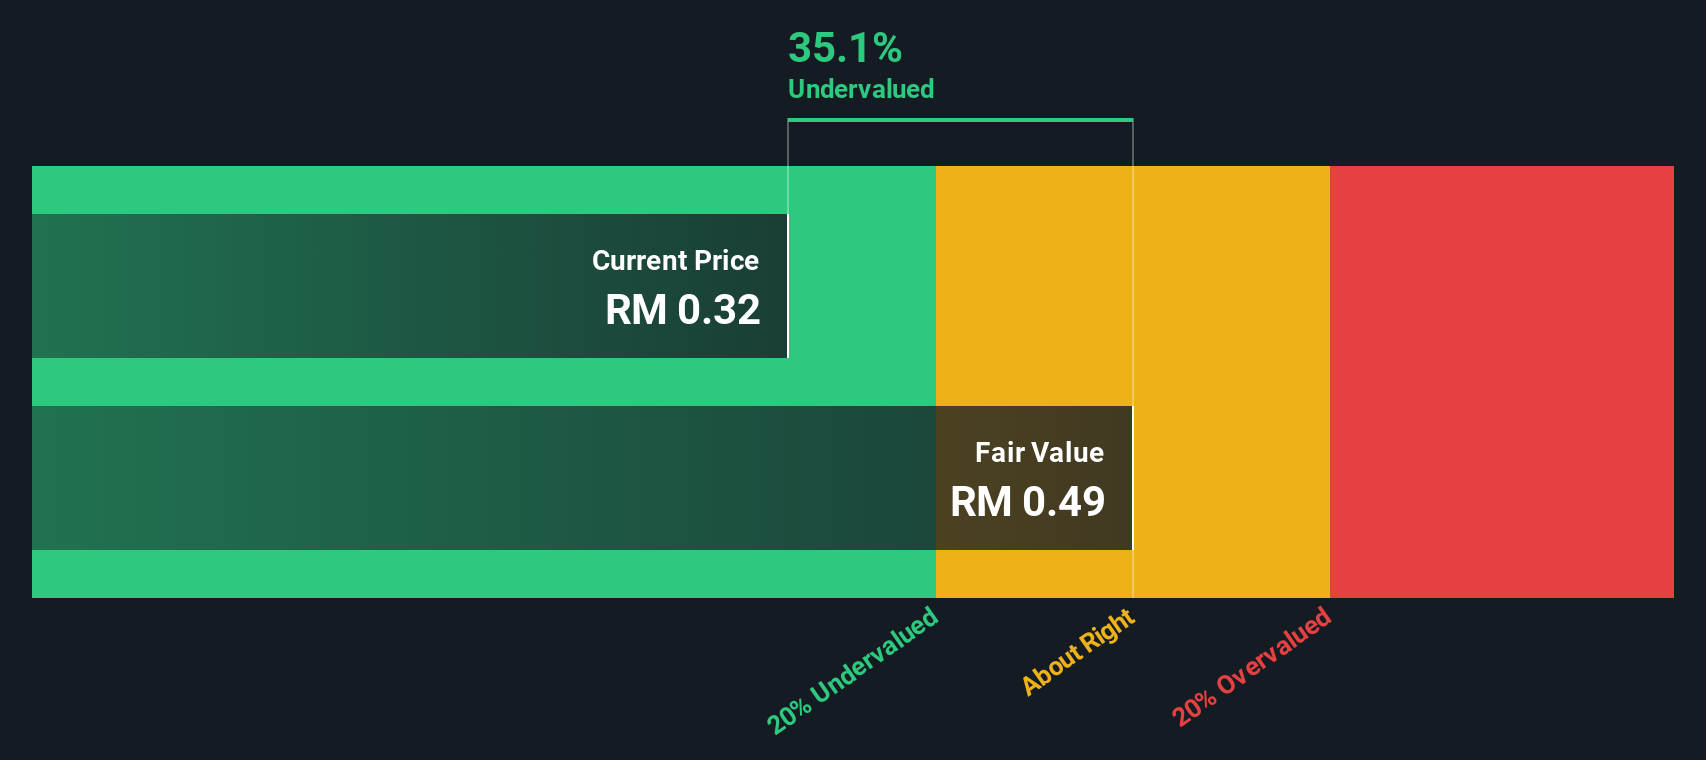
- Oxford Innotech Berhad's estimated fair value is RM0.49 based on 2 Stage Free Cash Flow to Equity
- Oxford Innotech Berhad's RM0.32 share price signals that it might be 35% undervalued
- Analyst price target for OXB is RM0.40 which is 20% below our fair value estimate
Does the December share price for Oxford Innotech Berhad (KLSE:OXB) reflect what it's really worth? Today, we will estimate the stock's intrinsic value by taking the expected future cash flows and discounting them to their present value. We will take advantage of the Discounted Cash Flow (DCF) model for this purpose. Before you think you won't be able to understand it, just read on! It's actually much less complex than you'd imagine.
Remember though, that there are many ways to estimate a company's value, and a DCF is just one method. For those who are keen learners of equity analysis, the Simply Wall St analysis model here may be something of interest to you.
Is Oxford Innotech Berhad Fairly Valued?
We're using the 2-stage growth model, which simply means we take in account two stages of company's growth. In the initial period the company may have a higher growth rate and the second stage is usually assumed to have a stable growth rate. To start off with, we need to estimate the next ten years of cash flows. Seeing as no analyst estimates of free cash flow are available to us, we have extrapolate the previous free cash flow (FCF) from the company's last reported value. We assume companies with shrinking free cash flow will slow their rate of shrinkage, and that companies with growing free cash flow will see their growth rate slow, over this period. We do this to reflect that growth tends to slow more in the early years than it does in later years.
Generally we assume that a dollar today is more valuable than a dollar in the future, and so the sum of these future cash flows is then discounted to today's value:
10-year free cash flow (FCF) estimate
| 2026 | 2027 | 2028 | 2029 | 2030 | 2031 | 2032 | 2033 | 2034 | 2035 | |
| Levered FCF (MYR, Millions) | RM16.4m | RM19.6m | RM22.5m | RM25.1m | RM27.4m | RM29.5m | RM31.4m | RM33.1m | RM34.8m | RM36.4m |
| Growth Rate Estimate Source | Est @ 26.36% | Est @ 19.57% | Est @ 14.81% | Est @ 11.48% | Est @ 9.15% | Est @ 7.52% | Est @ 6.38% | Est @ 5.58% | Est @ 5.02% | Est @ 4.62% |
| Present Value (MYR, Millions) Discounted @ 11% | RM14.8 | RM16.0 | RM16.6 | RM16.7 | RM16.5 | RM16.0 | RM15.4 | RM14.7 | RM13.9 | RM13.2 |
("Est" = FCF growth rate estimated by Simply Wall St)
Present Value of 10-year Cash Flow (PVCF) = RM154m
We now need to calculate the Terminal Value, which accounts for all the future cash flows after this ten year period. For a number of reasons a very conservative growth rate is used that cannot exceed that of a country's GDP growth. In this case we have used the 5-year average of the 10-year government bond yield (3.7%) to estimate future growth. In the same way as with the 10-year 'growth' period, we discount future cash flows to today's value, using a cost of equity of 11%.
Terminal Value (TV)= FCF2035 × (1 + g) ÷ (r – g) = RM36m× (1 + 3.7%) ÷ (11%– 3.7%) = RM541m
Present Value of Terminal Value (PVTV)= TV / (1 + r)10= RM541m÷ ( 1 + 11%)10= RM196m
The total value, or equity value, is then the sum of the present value of the future cash flows, which in this case is RM350m. The last step is to then divide the equity value by the number of shares outstanding. Relative to the current share price of RM0.3, the company appears quite undervalued at a 35% discount to where the stock price trades currently. Valuations are imprecise instruments though, rather like a telescope - move a few degrees and end up in a different galaxy. Do keep this in mind.
Important Assumptions
Now the most important inputs to a discounted cash flow are the discount rate, and of course, the actual cash flows. Part of investing is coming up with your own evaluation of a company's future performance, so try the calculation yourself and check your own assumptions. The DCF also does not consider the possible cyclicality of an industry, or a company's future capital requirements, so it does not give a full picture of a company's potential performance. Given that we are looking at Oxford Innotech Berhad as potential shareholders, the cost of equity is used as the discount rate, rather than the cost of capital (or weighted average cost of capital, WACC) which accounts for debt. In this calculation we've used 11%, which is based on a levered beta of 1.165. Beta is a measure of a stock's volatility, compared to the market as a whole. We get our beta from the industry average beta of globally comparable companies, with an imposed limit between 0.8 and 2.0, which is a reasonable range for a stable business.
View our latest analysis for Oxford Innotech Berhad
SWOT Analysis for Oxford Innotech Berhad
- Debt is not viewed as a risk.
- Earnings declined over the past year.
- Annual earnings are forecast to grow faster than the Malaysian market.
- Trading below our estimate of fair value by more than 20%.
- Revenue is forecast to grow slower than 20% per year.
Moving On:
Whilst important, the DCF calculation shouldn't be the only metric you look at when researching a company. It's not possible to obtain a foolproof valuation with a DCF model. Preferably you'd apply different cases and assumptions and see how they would impact the company's valuation. For example, changes in the company's cost of equity or the risk free rate can significantly impact the valuation. Can we work out why the company is trading at a discount to intrinsic value? For Oxford Innotech Berhad, there are three fundamental aspects you should consider:
- Risks: Case in point, we've spotted 2 warning signs for Oxford Innotech Berhad you should be aware of.
- Future Earnings: How does OXB's growth rate compare to its peers and the wider market? Dig deeper into the analyst consensus number for the upcoming years by interacting with our free analyst growth expectation chart.
- Other Solid Businesses: Low debt, high returns on equity and good past performance are fundamental to a strong business. Why not explore our interactive list of stocks with solid business fundamentals to see if there are other companies you may not have considered!
PS. The Simply Wall St app conducts a discounted cash flow valuation for every stock on the KLSE every day. If you want to find the calculation for other stocks just search here.
Have feedback on this article? Concerned about the content? Get in touch with us directly. Alternatively, email editorial-team (at) simplywallst.com.
This article by Simply Wall St is general in nature. We provide commentary based on historical data and analyst forecasts only using an unbiased methodology and our articles are not intended to be financial advice. It does not constitute a recommendation to buy or sell any stock, and does not take account of your objectives, or your financial situation. We aim to bring you long-term focused analysis driven by fundamental data. Note that our analysis may not factor in the latest price-sensitive company announcements or qualitative material. Simply Wall St has no position in any stocks mentioned.