
- LIVE QUOTES
- LEARN
- HELP
 Nasdaq
 Wall Street Journal
EN
Painful week for individual investors invested in Keymed Biosciences Inc. (HKG:2162) after 5.3% drop, institutions also suffered losses
Key Insights
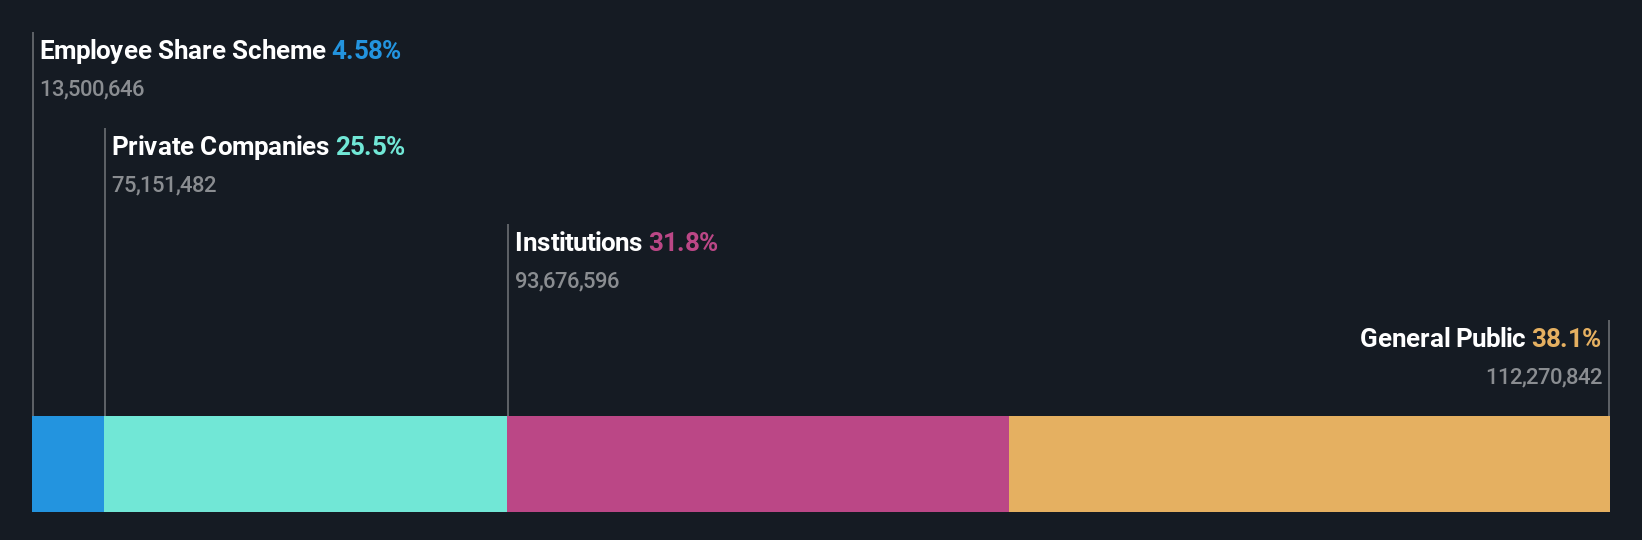
- Significant control over Keymed Biosciences by individual investors implies that the general public has more power to influence management and governance-related decisions
- The top 10 shareholders own 52% of the company
- 32% of Keymed Biosciences is held by Institutions
Every investor in Keymed Biosciences Inc. (HKG:2162) should be aware of the most powerful shareholder groups. With 38% stake, individual investors possess the maximum shares in the company. Put another way, the group faces the maximum upside potential (or downside risk).
While the holdings of individual investors took a hit after last week’s 5.3% price drop, institutions with their 32% holdings also suffered.
Let's take a closer look to see what the different types of shareholders can tell us about Keymed Biosciences.
Check out our latest analysis for Keymed Biosciences
What Does The Institutional Ownership Tell Us About Keymed Biosciences?
Institutions typically measure themselves against a benchmark when reporting to their own investors, so they often become more enthusiastic about a stock once it's included in a major index. We would expect most companies to have some institutions on the register, especially if they are growing.
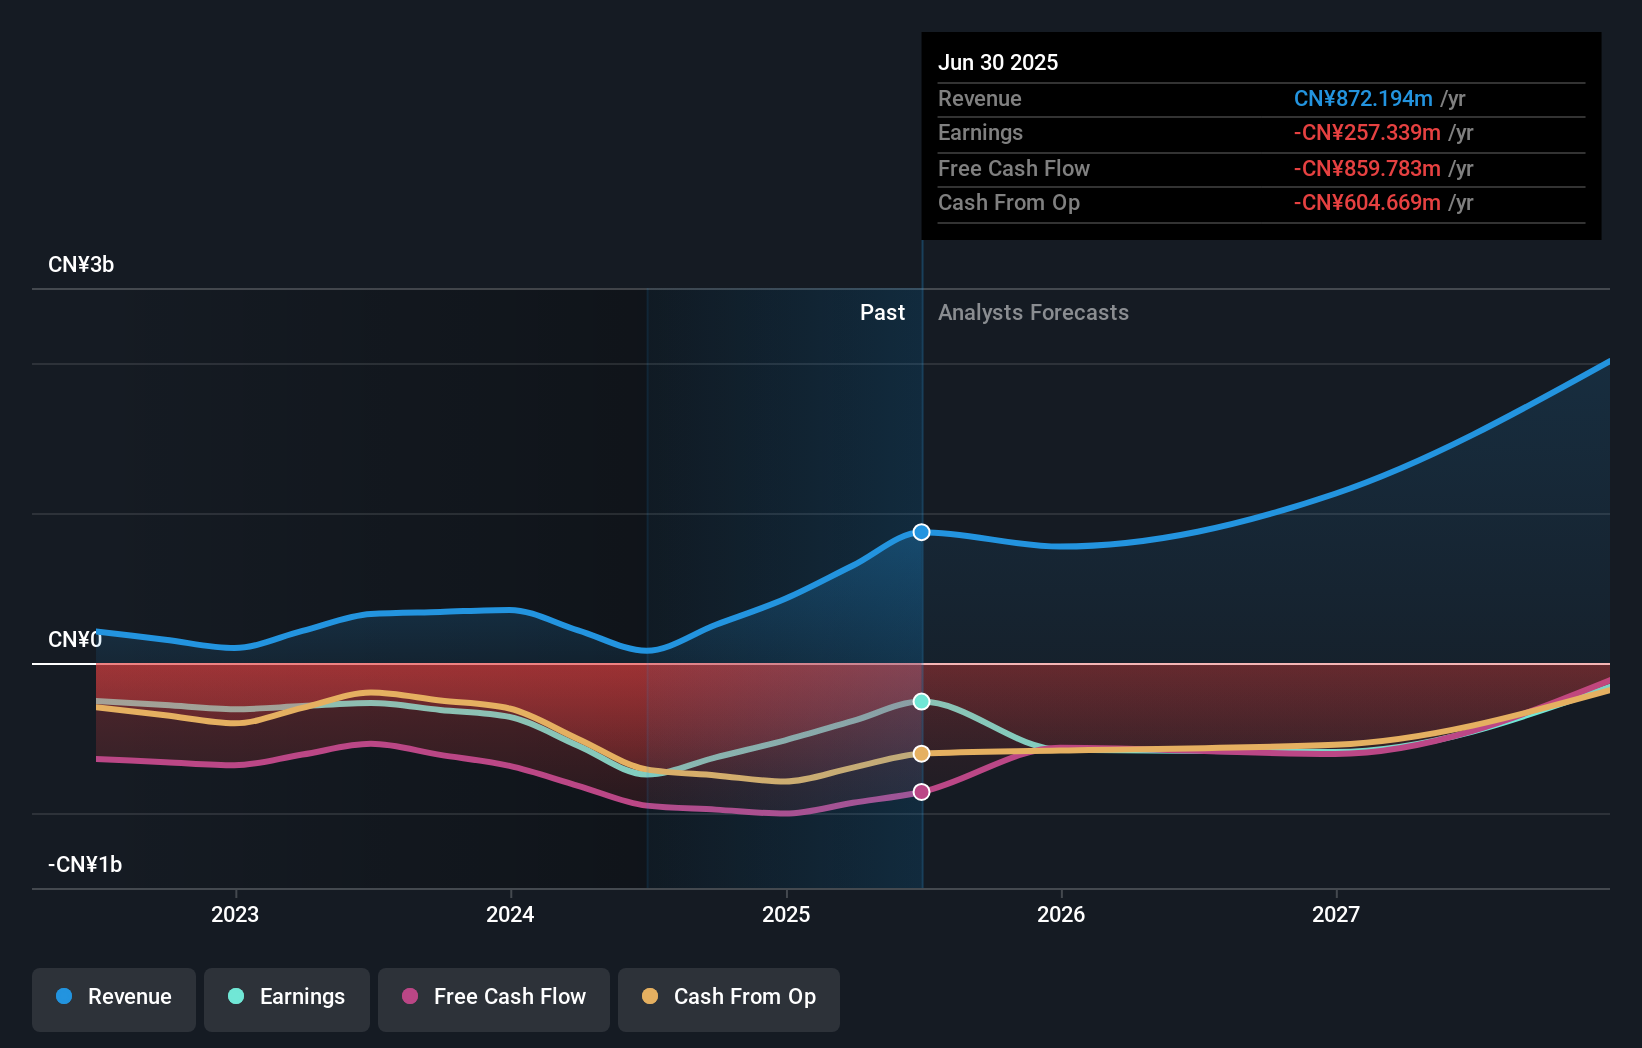
As you can see, institutional investors have a fair amount of stake in Keymed Biosciences. This suggests some credibility amongst professional investors. But we can't rely on that fact alone since institutions make bad investments sometimes, just like everyone does. If multiple institutions change their view on a stock at the same time, you could see the share price drop fast. It's therefore worth looking at Keymed Biosciences' earnings history below. Of course, the future is what really matters.
Keymed Biosciences is not owned by hedge funds. Moonshot Holdings Limited is currently the company's largest shareholder with 26% of shares outstanding. The second and third largest shareholders are Boyu Capital Group Holdings Ltd. and Keymed Talent Success Trust, with an equal amount of shares to their name at 4.6%.
We did some more digging and found that 10 of the top shareholders account for roughly 52% of the register, implying that along with larger shareholders, there are a few smaller shareholders, thereby balancing out each others interests somewhat.
While it makes sense to study institutional ownership data for a company, it also makes sense to study analyst sentiments to know which way the wind is blowing. There are a reasonable number of analysts covering the stock, so it might be useful to find out their aggregate view on the future.
Insider Ownership Of Keymed Biosciences
While the precise definition of an insider can be subjective, almost everyone considers board members to be insiders. Management ultimately answers to the board. However, it is not uncommon for managers to be executive board members, especially if they are a founder or the CEO.
Insider ownership is positive when it signals leadership are thinking like the true owners of the company. However, high insider ownership can also give immense power to a small group within the company. This can be negative in some circumstances.
We note our data does not show any board members holding shares, personally. We do not see this low level of ownership often, and it is possible our data is imperfect. But shareholders can click here to check if insiders have been selling stock.
General Public Ownership
The general public-- including retail investors -- own 38% stake in the company, and hence can't easily be ignored. This size of ownership, while considerable, may not be enough to change company policy if the decision is not in sync with other large shareholders.
Private Company Ownership
Our data indicates that Private Companies hold 26%, of the company's shares. It's hard to draw any conclusions from this fact alone, so its worth looking into who owns those private companies. Sometimes insiders or other related parties have an interest in shares in a public company through a separate private company.
Next Steps:
While it is well worth considering the different groups that own a company, there are other factors that are even more important. Consider risks, for instance. Every company has them, and we've spotted 1 warning sign for Keymed Biosciences you should know about.
But ultimately it is the future, not the past, that will determine how well the owners of this business will do. Therefore we think it advisable to take a look at this free report showing whether analysts are predicting a brighter future.
NB: Figures in this article are calculated using data from the last twelve months, which refer to the 12-month period ending on the last date of the month the financial statement is dated. This may not be consistent with full year annual report figures.
Have feedback on this article? Concerned about the content? Get in touch with us directly. Alternatively, email editorial-team (at) simplywallst.com.
This article by Simply Wall St is general in nature. We provide commentary based on historical data and analyst forecasts only using an unbiased methodology and our articles are not intended to be financial advice. It does not constitute a recommendation to buy or sell any stock, and does not take account of your objectives, or your financial situation. We aim to bring you long-term focused analysis driven by fundamental data. Note that our analysis may not factor in the latest price-sensitive company announcements or qualitative material. Simply Wall St has no position in any stocks mentioned.