
- LIVE QUOTES
- LEARN
- HELP
 Nasdaq
 Wall Street Journal
EN
Phreesia (PHR) Turns Q2 Profit, Testing Long‑Running Bearish Profitability Narrative
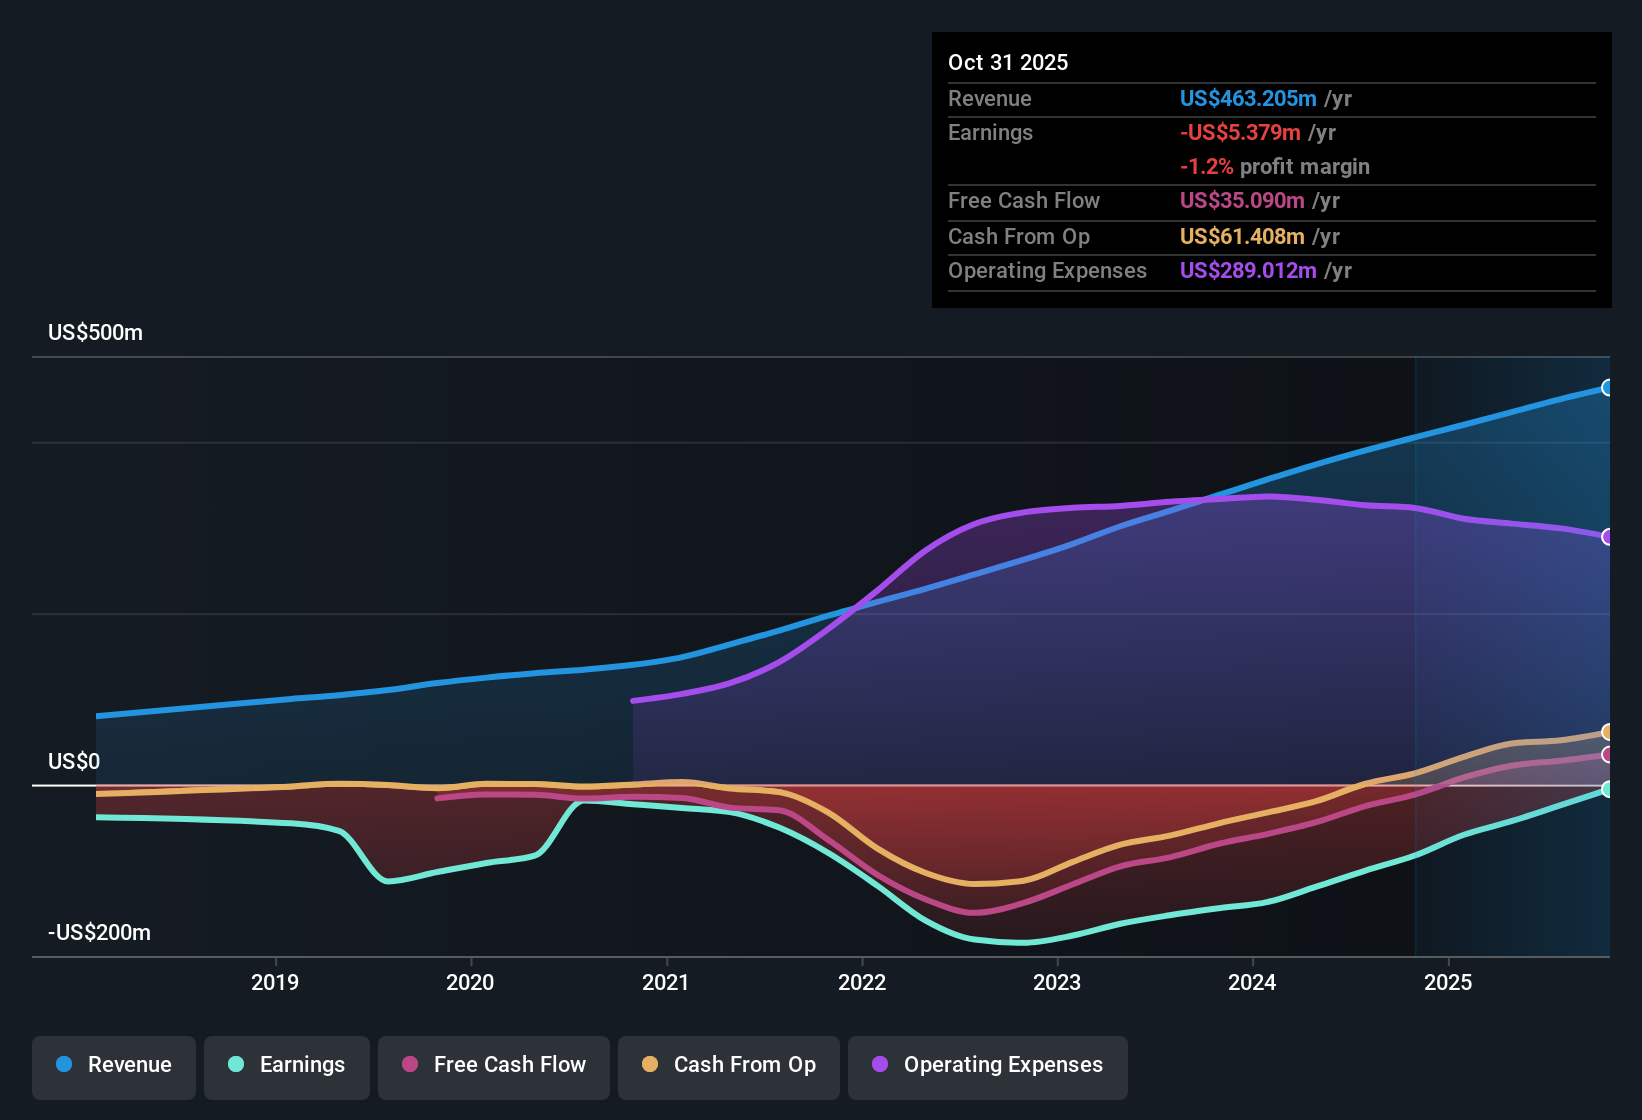
Phreesia (PHR) just posted its latest quarterly scorecard with Q2 2026 revenue of about $117 million and basic EPS of $0.01, setting a clearer snapshot of where the business stands on its path toward profitability. The company has seen revenue move from roughly $102 million in Q2 2025 to $117 million in Q2 2026, while quarterly EPS has shifted from a loss of about $0.31 to a modest profit, giving investors fresh data on how quickly margins might be stabilizing from here.
See our full analysis for Phreesia.With the headline numbers on the table, the next step is to weigh these results against the dominant narratives around Phreesia, highlighting where the latest margin trends back up the story and where they start to push back on it.
See what the community is saying about Phreesia
From $102 million to $117 million, growth is steady but not explosive
- Over the last five reported quarters, revenue has moved from about $102 million in Q2 2025 to roughly $117 million in Q2 2026. This lines up with forecasts calling for revenue growth of around 10.4 percent per year, just under the 10.7 percent reference rate for the broader US market.
- Analysts' consensus view ties this mid single digit quarterly revenue climb to the rollout of more digital health modules and AI tools,
- Supporters point out that adding features like enhanced bill pay and appointment readiness can lift recurring revenue per client over time. This fits with revenue rising over multiple quarters from about $101 million in Q1 2025 to roughly $117 million in Q2 2026.
- At the same time, the consensus narrative expects these add ons and AI efficiencies to drive better margins. Trailing twelve month numbers still show negative net income of about $24 million, so the margin improvement story is not yet visible in the backward looking data.
Losses narrowing, but trailing year still in the red
- On a single quarter view, net income has moved from a loss of about $19.7 million in Q1 2025 to a small profit of roughly $0.7 million in Q2 2026. Yet on a trailing twelve month basis the company still reports a net loss of about $24.1 million and a negative margin of 9.8 percent.
- Bulls argue that this shift from larger quarterly losses toward breakeven heavily supports the optimistic case for 44.67 percent annual earnings growth and a move to about $52.6 million of earnings by 2028,
- The step up from a loss of roughly $18.0 million in Q2 2025 to a slight profit one year later is consistent with the idea that operating leverage from more software usage per client can help margins rise from about negative 9.8 percent toward the forecast 8.6 percent over three years.
- However, the trailing twelve month loss shows that, despite quarterly improvement, the business is still burning earnings overall. This means the bullish view depends on this positive quarterly pattern continuing rather than just one or two better quarters.
Valuation upside vs. five year loss trend
- At a share price of $15.78, Phreesia trades at about 2.1 times sales compared with 2.4 times for the US Healthcare Services industry and 2.6 times for peers. It also trades well below a DCF fair value of roughly $81.46, even though trailing twelve month losses have grown at around 2.6 percent per year over the past five years.
- Bears focus on that persistent loss profile to question whether the apparent valuation discount is deserved,
- They highlight that, despite revenue reaching about $449.7 million on a trailing twelve month basis, the company still reports negative net income of roughly $24.1 million. This means the current lower price to sales multiple could simply reflect the market pricing in ongoing losses.
- At the same time, the gap between the current $15.78 share price, the 2.1 times sales multiple, and the much higher $81.46 DCF fair value estimate shows that if the company does achieve the forecast profitability, the stock could have substantial room to re rate. The bearish stance therefore rests on Phreesia failing to follow through on that earnings path.
Next Steps
To see how these results tie into long-term growth, risks, and valuation, check out the full range of community narratives for Phreesia on Simply Wall St. Add the company to your watchlist or portfolio so you'll be alerted when the story evolves.
See the numbers differently? Use that angle to shape your own view in just a few minutes and share it with the community: Do it your way.
A great starting point for your Phreesia research is our analysis highlighting 4 key rewards and 1 important warning sign that could impact your investment decision.
See What Else Is Out There
Despite recent quarterly progress, Phreesia still carries a multi year loss record and negative trailing margins, leaving its profitability profile unproven and risky.
If that uncertainty gives you pause, you may want to shift your focus toward companies already pairing net cash with demonstrated expansion. You can start by scanning 1089 pre-screened stocks with net cash and a strong growth track record right now, before the market fully catches on.
This article by Simply Wall St is general in nature. We provide commentary based on historical data and analyst forecasts only using an unbiased methodology and our articles are not intended to be financial advice. It does not constitute a recommendation to buy or sell any stock, and does not take account of your objectives, or your financial situation. We aim to bring you long-term focused analysis driven by fundamental data. Note that our analysis may not factor in the latest price-sensitive company announcements or qualitative material. Simply Wall St has no position in any stocks mentioned.
Have feedback on this article? Concerned about the content? Get in touch with us directly. Alternatively, email editorial-team@simplywallst.com