
- LIVE QUOTES
- LEARN
- HELP
 Nasdaq
 Wall Street Journal
EN
Does Crescent Energy’s Recent Rebound Signal a Mispriced Opportunity in 2025?
- If you are wondering whether Crescent Energy is a quietly mispriced energy play or a value trap in the making, you are not alone. This breakdown aims to cut through the noise.
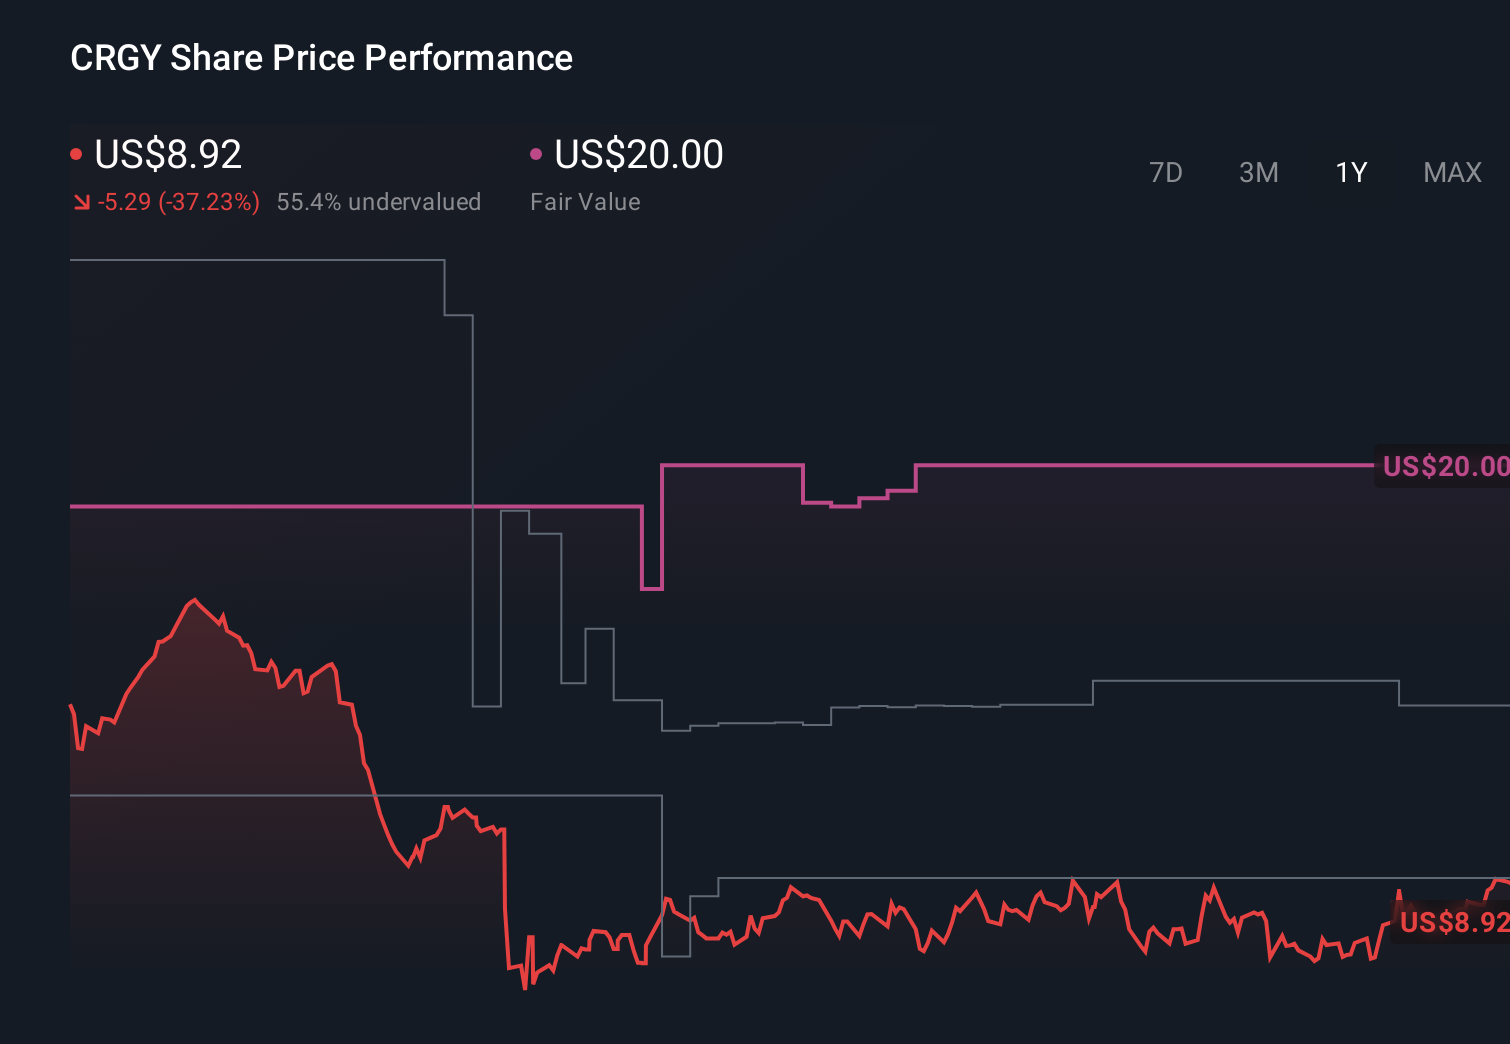
- Despite trading around $9.76, the stock has climbed 0.6% over the last week and 8.9% over the past month, even though it is still down 34.4% year to date and 30.5% over the last year.
- Much of this recent bounce has come as investors rotate back into select energy names and reassess companies with scale, cash flow and asset diversification rather than just headline growth. Broader sector sentiment around commodity prices and capital discipline has also shifted, giving names like Crescent a second look from value focused investors.
- On our framework, Crescent Energy posts a valuation score of 3/6, suggesting it screens as undervalued on roughly half of the key checks we use. Next we will unpack what that score really means by walking through different valuation approaches, before closing with an even more practical way to think about Crescent's true worth.
Find out why Crescent Energy's -30.5% return over the last year is lagging behind its peers.
Approach 1: Crescent Energy Discounted Cash Flow (DCF) Analysis
A Discounted Cash Flow model takes the cash Crescent Energy is expected to generate in the future, then discounts those projections back into a single value in today's dollars. It is essentially asking what that future stream of cash is worth right now.
Crescent's latest twelve month free cash flow is negative at around $144.1 million, but analysts and internal estimates see a sharp turnaround, with projected free cash flow climbing toward roughly $858.5 million by 2035. Early years in the forecast draw on analyst estimates, while later years are extrapolated by Simply Wall St using a 2 Stage Free Cash Flow to Equity framework that tapers growth over time.
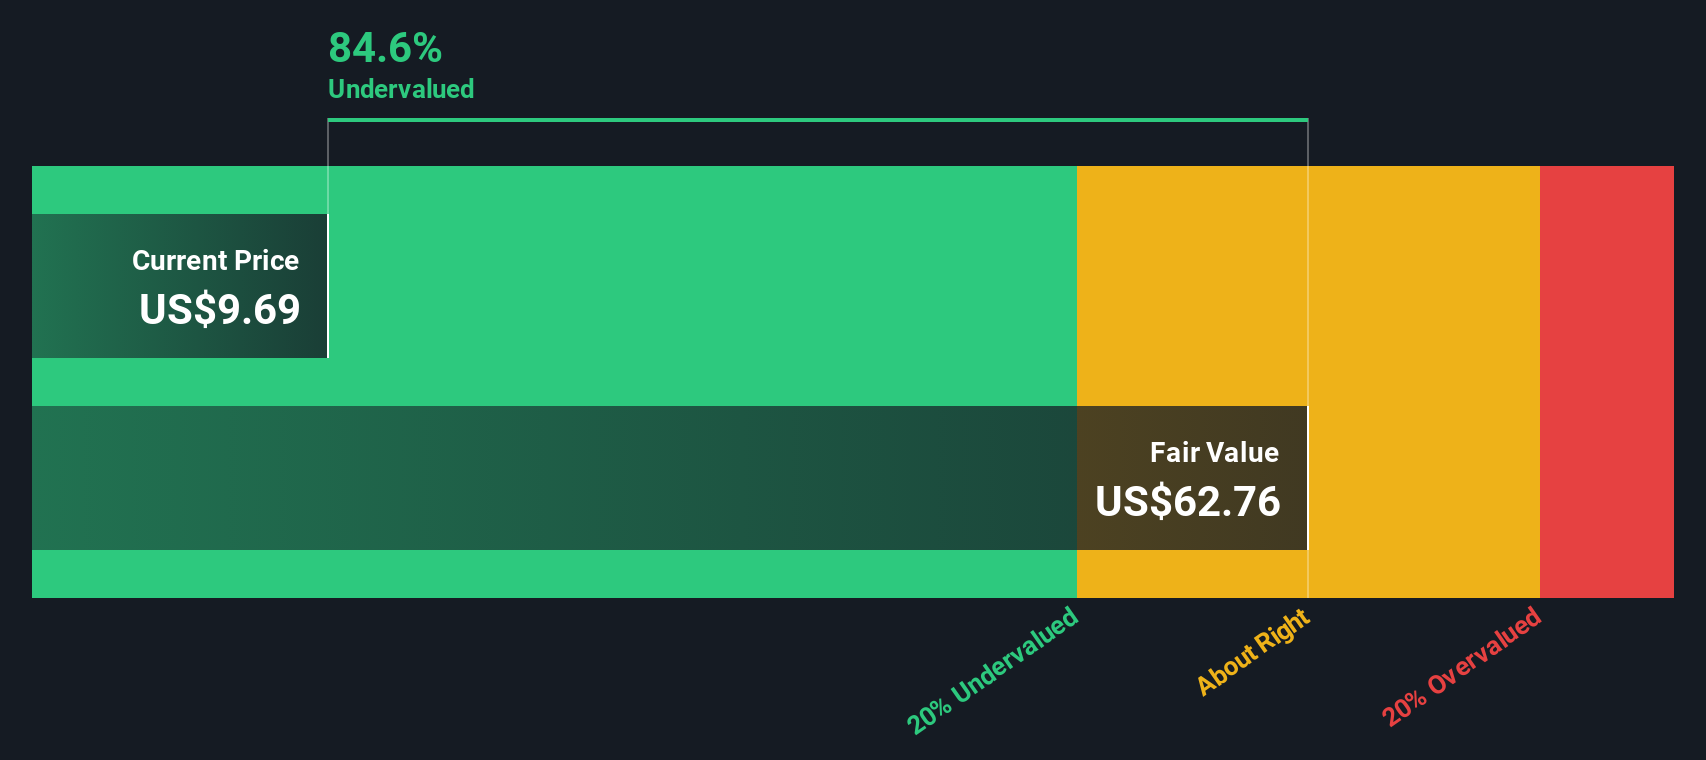
When all these future cash flows are discounted back and divided by the number of shares, the model arrives at an intrinsic value of about $55.71 per share. Compared with a current share price near $9.76, the DCF output implies the stock is about 82.5% undervalued. This indicates that, under the model's assumptions, the market price is significantly below the value suggested by the long term cash flow projections.
Result: UNDERVALUED
Our Discounted Cash Flow (DCF) analysis suggests Crescent Energy is undervalued by 82.5%. Track this in your watchlist or portfolio, or discover 904 more undervalued stocks based on cash flows.
Approach 2: Crescent Energy Price vs Earnings
For profitable companies like Crescent Energy, the price to earnings, or PE, ratio is a straightforward way to judge whether the share price makes sense relative to the profits the business is generating. Investors generally accept that faster growing, lower risk companies deserve a higher PE, while slower growing, more cyclical or riskier businesses should trade on a lower multiple.
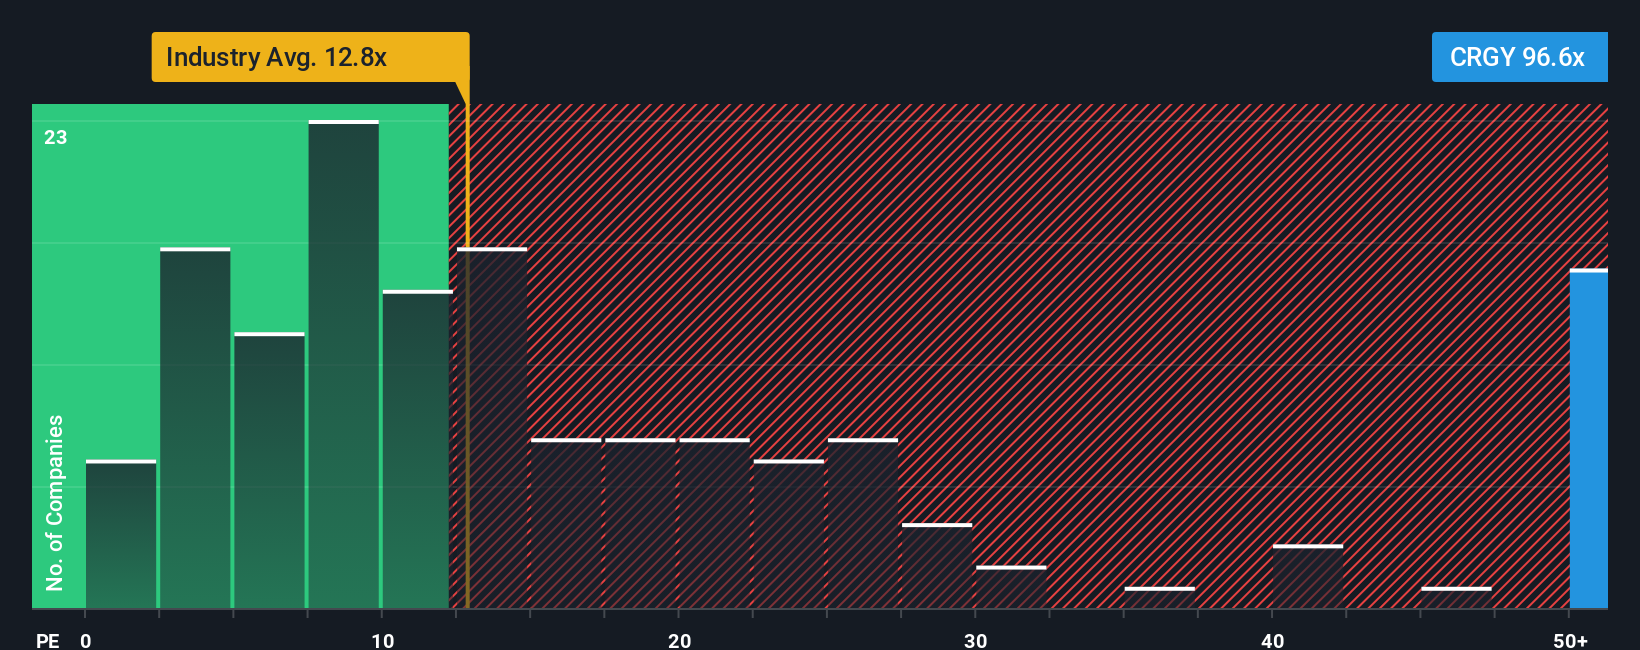
Crescent currently trades on a rich PE of about 105.63x, far above the Oil and Gas industry average of roughly 13.59x and the peer group average near 9.90x. On the surface, that gap suggests the market is already pricing in very strong future earnings growth or a much lower risk profile than typical sector names.
Simply Wall St's Fair Ratio helps put that premium into better context. This proprietary measure estimates what a reasonable PE multiple should be, given Crescent's specific mix of earnings growth, margins, industry, market cap and risk profile. For Crescent, the Fair Ratio comes out at around 22.00x, which is substantially below the current 105.63x. That implies the shares look expensive on an earnings basis, even after adjusting for the company's characteristics.
Result: OVERVALUED
PE ratios tell one story, but what if the real opportunity lies elsewhere? Discover 1447 companies where insiders are betting big on explosive growth.
Upgrade Your Decision Making: Choose your Crescent Energy Narrative
Earlier we mentioned that there is an even better way to understand valuation, so let's introduce you to Narratives, a simple tool on Simply Wall St's Community page that lets you connect your view of Crescent Energy's story to a concrete forecast for its future revenue, earnings and margins, and then to your own fair value estimate. A Narrative is your investment story written in numbers. You plug in what you believe about things like production growth, margin improvement and the right PE multiple, and the platform turns that into a full financial forecast and an implied fair value that you can compare with the current share price to decide whether Crescent looks like a buy, a hold or a sell. Narratives on the platform are dynamic, so when new information comes in, like the updated $14.18 analyst fair value, revised 9.74% revenue growth expectations, 14.50% margin forecasts or a fresh earnings report, your view and others can be updated quickly. For Crescent, one investor might build a bullish Narrative around stronger margin expansion and a fair value closer to the high $17.00 target. Another might use more conservative assumptions that pull fair value toward the low $12.00 target, and both perspectives can sit side by side for you to compare.
Do you think there's more to the story for Crescent Energy? Head over to our Community to see what others are saying!
This article by Simply Wall St is general in nature. We provide commentary based on historical data and analyst forecasts only using an unbiased methodology and our articles are not intended to be financial advice. It does not constitute a recommendation to buy or sell any stock, and does not take account of your objectives, or your financial situation. We aim to bring you long-term focused analysis driven by fundamental data. Note that our analysis may not factor in the latest price-sensitive company announcements or qualitative material. Simply Wall St has no position in any stocks mentioned.
Have feedback on this article? Concerned about the content? Get in touch with us directly. Alternatively, email editorial-team@simplywallst.com