
- LIVE QUOTES
- LEARN
- HELP
 Nasdaq
 Wall Street Journal
EN
Redwire’s Recent 34% Surge Versus DCF and Sales Metrics in 2025
- If you are wondering whether Redwire at around $7.50 is a bargain or a value trap, you are not alone. That is exactly what we are going to unpack.
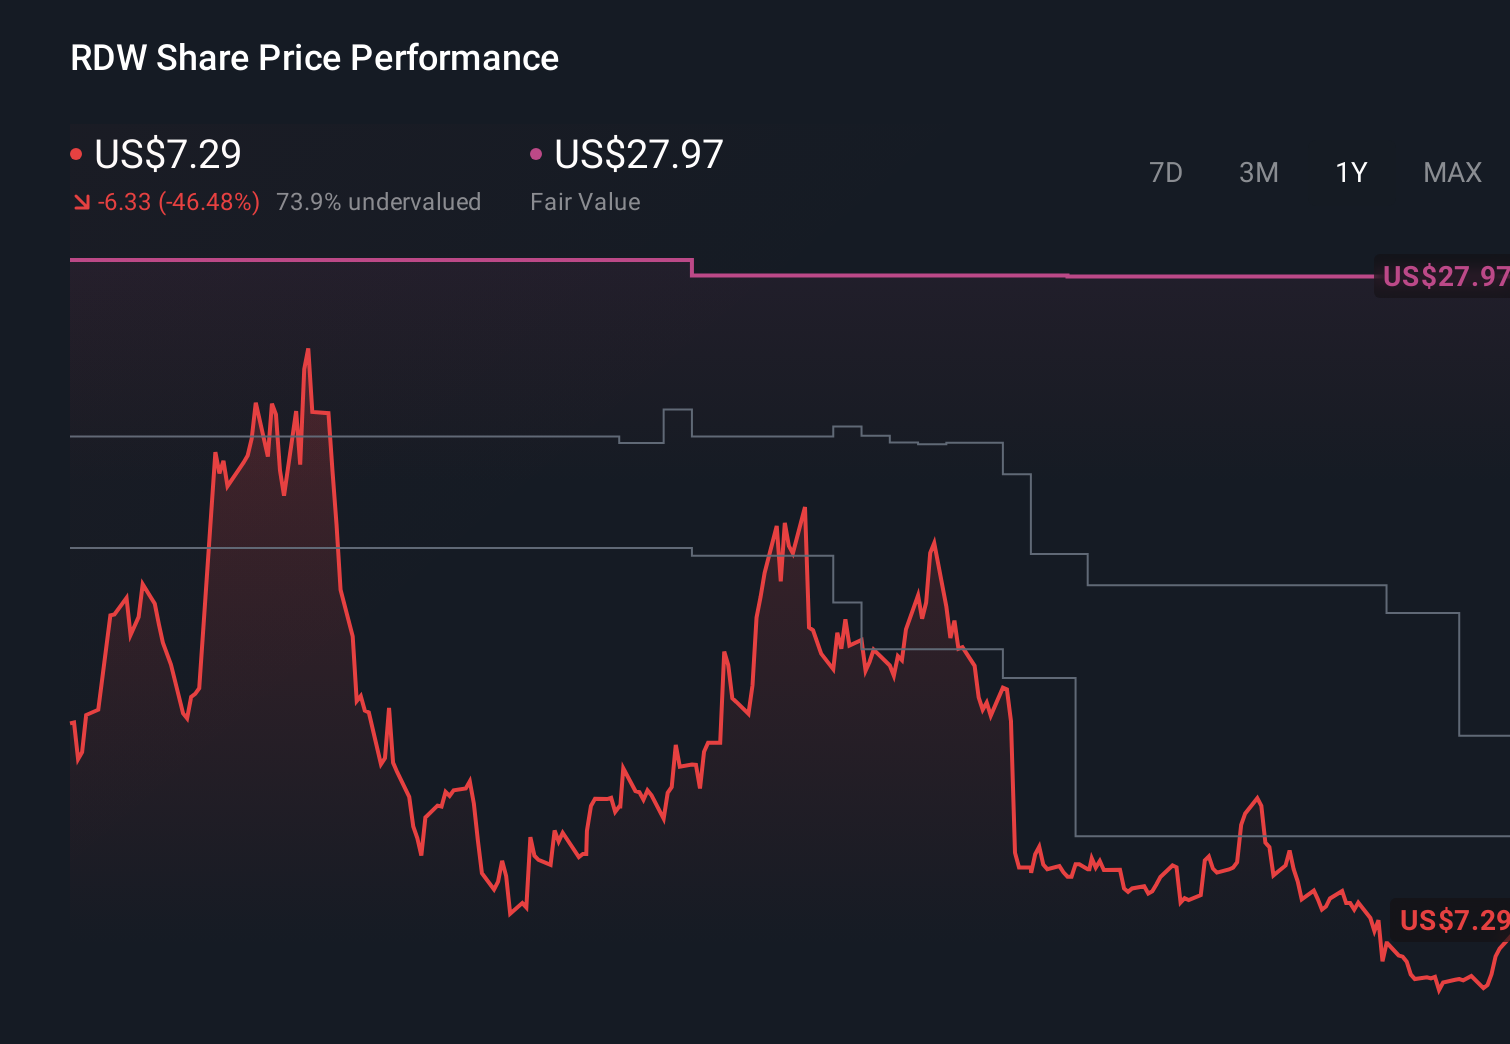
- The stock has jumped 34.3% over the last week and 21.2% over the past month, but it is still down 56.1% year to date and 35.9% over the last year, even after a 3 year gain of 281.6%.
- Those swings have come as investors digest a steady drumbeat of contract wins and broader enthusiasm for space infrastructure and defense related spending, which have put Redwire back on some growth radars. At the same time, the stock is still carrying the scars of earlier volatility and execution concerns, which keeps sentiment mixed.
- Against that backdrop, Redwire currently scores just 0/6 on our valuation checks. This means traditional metrics do not yet flag it as obviously undervalued, but they also do not tell the whole story. Next we will walk through those valuation approaches in detail, before finishing with a more nuanced way to think about what Redwire might really be worth.
Redwire scores just 0/6 on our valuation checks. See what other red flags we found in the full valuation breakdown.
Approach 1: Redwire Discounted Cash Flow (DCF) Analysis
The Discounted Cash Flow model projects Redwire future cash flows and then discounts them back to today to estimate what the business might be worth in $ right now.
Redwire latest twelve month Free Cash Flow is about $159.4 Million in the red, so the valuation rests heavily on a sharp turnaround. Analysts see FCF improving to around $60.8 Million by 2026 and $24.6 Million by 2027, with Simply Wall St then extrapolating a gradual step down to roughly $3.7 Million by 2035 as growth normalizes. Each of these cash flows is discounted back using a required rate of return to reflect risk and the time value of money.
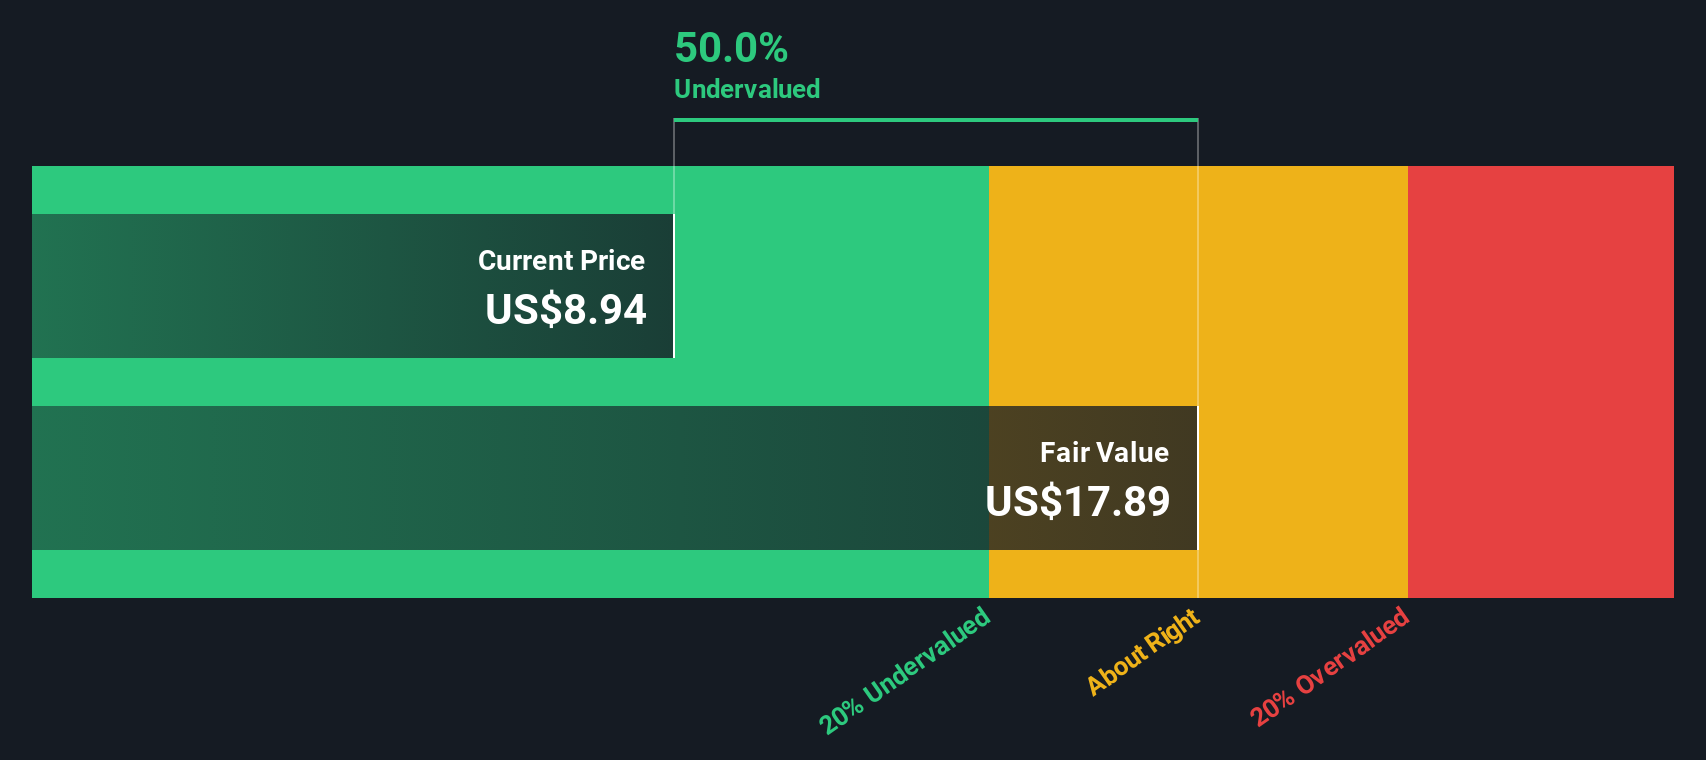
Putting all of this together, the model arrives at an estimated intrinsic value of roughly $0.87 per share. Compared with the recent share price around $7.50, that implies Redwire is about 755.2% overvalued on this cash flow view, so the current market optimism is far ahead of the DCF math.
Result: OVERVALUED
Our Discounted Cash Flow (DCF) analysis suggests Redwire may be overvalued by 755.2%. Discover 907 undervalued stocks or create your own screener to find better value opportunities.
Approach 2: Redwire Price vs Sales
For companies like Redwire that are still working toward consistent profitability, the price to sales ratio is often a more useful yardstick than earnings based metrics. Sales are typically less volatile than earnings, so they can provide a clearer view of how much investors are willing to pay for each dollar of revenue.
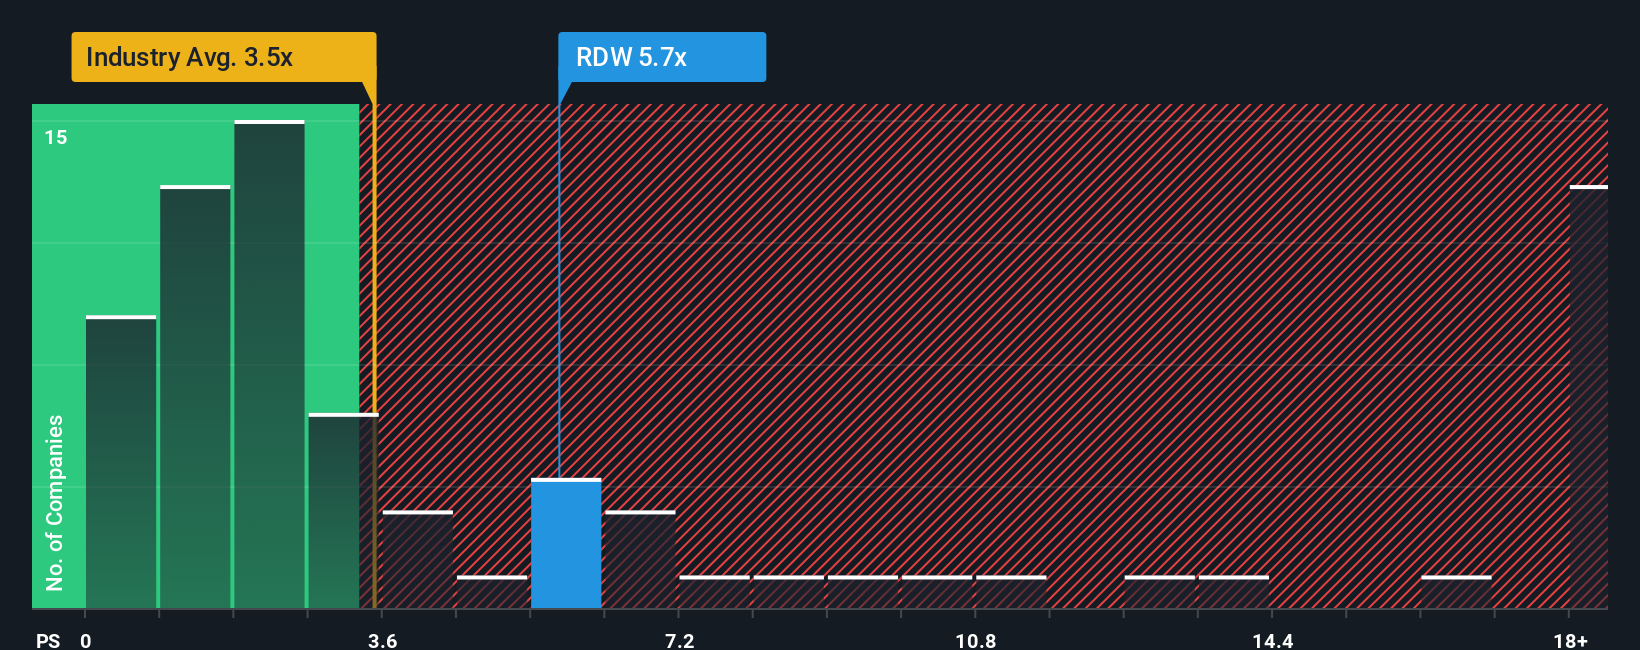
In general, faster growth and lower risk justify a higher price to sales multiple, while slower growth or higher uncertainty call for a lower one. Redwire currently trades on a price to sales ratio of about 4.17x, which is meaningfully above the Aerospace and Defense industry average of roughly 3.10x and also above the peer average of about 1.47x. On the surface, that suggests the market is pricing in strong growth or a strategic edge.
Simply Wall St goes a step further with its Fair Ratio, which estimates what a reasonable price to sales multiple should be after factoring in Redwire growth outlook, profitability profile, industry, market cap and risk. For Redwire, this Fair Ratio is around 1.72x, well below the current 4.17x, implying the stock is trading at a premium that its fundamentals do not fully support.
Result: OVERVALUED
PS ratios tell one story, but what if the real opportunity lies elsewhere? Discover 1446 companies where insiders are betting big on explosive growth.
Upgrade Your Decision Making: Choose your Redwire Narrative
Earlier we mentioned that there is an even better way to understand valuation. Let us introduce you to Narratives, a simple framework on Simply Wall St Community where you write the story you believe about a company, translate that story into estimates for future revenue, earnings and margins, and automatically link those assumptions to a fair value that you can compare with today’s price to help inform whether you might buy, hold or sell. All of this then updates dynamically as new news or earnings arrive. For Redwire, one investor might build a bullish Narrative around accelerating government space orders and high margin platforms that supports a fair value near the top analyst target of about $28. A more cautious investor could focus on contract risk, dilution and integration challenges to arrive closer to the low end near $10, giving you two different but clearly quantified stories instead of one blunt overvalued or undervalued label.
Do you think there's more to the story for Redwire? Head over to our Community to see what others are saying!
This article by Simply Wall St is general in nature. We provide commentary based on historical data and analyst forecasts only using an unbiased methodology and our articles are not intended to be financial advice. It does not constitute a recommendation to buy or sell any stock, and does not take account of your objectives, or your financial situation. We aim to bring you long-term focused analysis driven by fundamental data. Note that our analysis may not factor in the latest price-sensitive company announcements or qualitative material. Simply Wall St has no position in any stocks mentioned.
Have feedback on this article? Concerned about the content? Get in touch with us directly. Alternatively, email editorial-team@simplywallst.com